YouZum

Uncategorized

AI, Committee, News, Uncategorized

Databricks Open-Sources Omnigent: A Meta-Harness That Composes, Governs, and Shares AI Agents Across Claude Code, Codex, and Pi

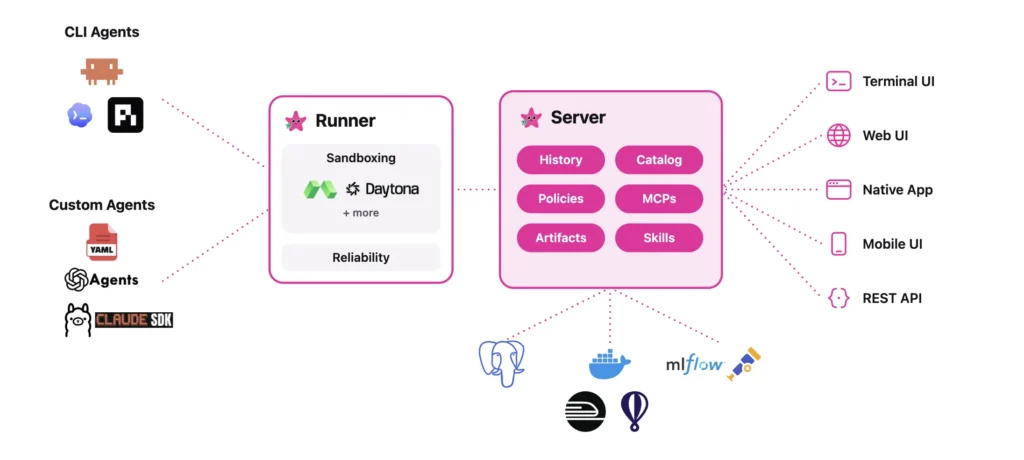
Databricks released Omnigent, an open source ‘meta-harness’ for AI agents. The project ships under the Apache 2.0 license. The Databricks AI team built it with Neon. A harness is the wrapper around a model that turns it into an agent. Claude Code, Codex, and Pi are harnesses. Omnigent sits one level above them. It treats each harness as an interchangeable part of a larger system. Many engineers now juggle four or five agents at once. They copy text between coding agents, search tools, Docs, and Slack. Each harness only understands its own sessions. Omnigent adds a shared layer where composition, control, and collaboration live. What is Omnigent Omnigent is a common interface above command-line agents and agent SDKs. It wraps terminal coding agents such as Claude Code, Codex, and Pi. It also wraps SDKs like OpenAI Agents and the Claude Agents SDK. The design rests on one observation. However a harness calls its model internally, the user-facing interface is the same. Messages and files go in. Text streams and tool calls come out. Omnigent standardizes that interface so harnesses become swappable. You supply the models and the infrastructure. Omnigent runs the agents on top. It can coordinate several of them as interchangeable workers under one orchestrator. How Omnigent Works The architecture has two parts. A runner wraps any agent in a sandboxed session with a uniform API. A server provides policies and sharing. The server exposes every session over the terminal, the app, and web APIs. One command starts a session in your terminal. It also launches a local web UI at localhost:6767. The same session appears in the browser or on a phone. Messages, sub-agents, terminals, and files stay in sync. The CLI installs under two names, omnigent and omni. They are interchangeable. On first run, it detects model credentials already in your environment. https://omnigent.ai/ Composition, Control, and Collaboration Databricks team frames Omnigent around three capabilities: Composition means combining models, harnesses, and techniques without rewriting code. You switch between Claude Code, Codex, Pi, and custom agents with one-line changes. Control means stateful, contextual policies. They track agent actions and enforce guardrails at the meta-harness layer, not through prompts. One example pauses an agent after every $100 it spends. Another requires human approval to git push once the agent installs a new npm package. Collaboration means sharing live agent sessions by URL. Teammates watch the agent work and chat with it in real time. They can comment on files, co-drive the session, or fork the conversation. An OS sandbox, called Omnibox, underpins this. It can lock down OS access and transform network requests. For instance, it can keep your GitHub token hidden from the agent. The token is injected only in the egress proxy on approved requests. Use Cases and Examples Two example agents ship with the repository: Polly is a multi-agent coding orchestrator. It writes no code itself. It plans, then delegates work to coding sub-agents in parallel git worktrees. Each diff routes to a reviewer from a different vendor than the writer. You merge the result. Debby is a brainstorming partner with two heads. One head is Claude, the other GPT. Every question goes to both, with answers shown side by side. Type /debate and the heads critique each other before converging. Other practical patterns follow the same shape. A frontier advisor model can guide a cheaper open-source worker. A lead agent can orchestrate parallel subagents. Different LLMs can handle planning, search, and code generation in one flow. Interactive Concept Demo Marktechpost team has created a interactive demo (below) that lets you experience Omnigent’s meta-harness workflow firsthand. You pick a task for the Polly orchestrator, which plans it and delegates to three sub-agents: Claude Code, Codex, and Pi that are running in parallel and streaming their steps live. A session cost meter ticks up as they work, and the two policy toggles show Omnigent’s control layer in action: the cost budget pauses the run at $3.00 for your approval, and a contextual policy halts a git push that follows an npm install until you allow it. Once the sub-agents finish, each diff is cross-reviewed by a different vendor than the one that wrote it, then marked ready to merge. Terminal, Web, and Mobile tabs show the same session staying in sync across interfaces. It’s an illustrative simulation, no live models are called. ◇ Omnigent Meta-Harness One orchestrator. Many harnesses. One governed session. Interactive concept demo 1 · Pick a task for the orchestrator (Polly) Build REST endpoint + tests Refactor auth module Add caching layer 2 · Policies (control layer) Cost budget — pause at $3.00 Approve git push after npm install Run session ⌘ Terminal ▤ Web UI ▢ Mobile same session · in sync Session LLM cost $0.00 Orchestrator · Polly (writes no code; plans & delegates) Idle. Pick a task and press “Run session”. Claude Codewaiting Codexwaiting Piwaiting ✓ Ready to merge. 3 diffs cross-reviewed by a different vendor than the writer. Illustrative simulation of the Omnigent workflow — no live models are called. Learn more at omnigent.ai · GitHub · Apache 2.0 · Alpha. Marktechpost · AI Dev & Research Media Policy paused the session Reason goes here. Deny / stop Approve & continue ◇ Omnigent Meta-Harness One orchestrator. Many harnesses. One governed session. Interactive concept demo 1 · Pick a task for the orchestrator (Polly) Build REST endpoint + tests Refactor auth module Add caching layer 2 · Policies (control layer) Cost budget — pause at $3.00 Approve git push after npm install Run session ⌘ Terminal ▤ Web UI ▢ Mobile same session · in sync Session LLM cost $0.00 Orchestrator · Polly (writes no code; plans & delegates) Idle. Pick a task and press “Run session”. Claude Codewaiting Codexwaiting Piwaiting ✓ Ready to merge. 3 diffs cross-reviewed by a different vendor than the writer. Illustrative simulation of the Omnigent workflow — no live models are called. Learn more at omnigent.ai · GitHub · Apache 2.0 · Alpha. Marktechpost · AI

Databricks Open-Sources Omnigent: A Meta-Harness That Composes, Governs, and Shares AI Agents Across Claude Code, Codex, and Pi Read Post »

AI, Committee, News, Uncategorized

Moonshot AI Releases Kimi K2.7-Code: a Coding Model Reporting +21.8% on Kimi Code Bench v2 Over K2.6

This week, Moonshot AI released Kimi K2.7-Code. It is a coding-focused, agentic model. The model weights ship on Hugging Face under a Modified MIT license. You can also reach it through the Kimi API and Kimi Code. K2.7-Code targets long-horizon software engineering, not general chat. It plans, edits, runs tools, and debugs across many steps. Moonshot pairs the model with a subscription coding platform around it. Kimi K2.7-Code K2.7-Code is a Mixture-of-Experts model. It holds 1T total parameters and activates 32B per token. The design uses 384 experts, with 8 selected per token and 1 shared. It has 61 layers, including 1 dense layer. Attention uses MLA, and the feed-forward path uses SwiGLU. A MoonViT vision encoder adds 400M parameters for image and video input. The model ships with native INT4 quantization. The context window is 256K tokens (262,144). Two constraints matters: Thinking mode is mandatory; disabling it returns an API error. Sampling is fixed: temperature 1.0, top_p 0.95, n 1, penalties 0.0. Default max output is 32,768 tokens. You can self-host with vLLM, SGLang, or KTransformers. The Hugging Face repository is large, roughly 595 GB on disk. This is a server-class deployment target, not a laptop model. Benchmark Moonshot team published six benchmark rows. They compare K2.7-Code against K2.6, GPT-5.5, and Claude Opus 4.8. K2.7-Code beats K2.6 on every row. The largest coding jump is Kimi Code Bench v2, from 50.9 to 62.0. Benchmark Kimi K2.6 Kimi K2.7-Code GPT-5.5 Claude Opus 4.8 K2.7 vs K2.6 Kimi Code Bench v2 50.9 62.0 69.0 67.4 +21.8% Program Bench 48.3 53.6 69.1 63.8 +11.0% MLS Bench Lite 26.7 35.1 35.5 42.8 +31.5% Kimi Claw 24/7 Bench 42.9 46.9 52.8 50.4 +9.3% MCP Atlas 69.4 76.0 79.4 81.3 +9.5% MCP Mark Verified 72.8 81.1 92.9 76.4 +11.4% K2.7-Code does beat Opus 4.8 on MCP Mark Verified, 81.1 versus 76.4. It also lands close to GPT-5.5 on MLS Bench Lite. K2.7-Code ran in Kimi Code CLI, GPT-5.5 in Codex xhigh, and Opus 4.8 in Claude Code xhigh. Reasoning-Token Efficiency: A Cost Claim, Not Just Quality Moonshot team reports about 30% lower reasoning-token usage than K2.6. It frames this as ‘less overthinking.’ Reasoning tokens bill as output tokens on most price cards. Agentic coding runs hundreds or thousands of steps. Each plan, retry, and verification pays the thinking cost again. A 30% cut compounds across a long run. The effect lands in three places at once. First, lower output-token cost per task. Second, faster steps, which helps interactive CLI sessions. Third, more steps before hitting context limits. Use Cases With Examples Repo-scale refactors are the main use case. Point the agent at a failing test suite. It reads files, edits across modules, then reruns tests until green. Code review is a second fit. Feed a pull request diff and ask for risk analysis. The 256K window holds large diffs, logs, and related files together. MCP tool-use workflows are a third fit. K2.7-Code scored 81.1 on MCP Mark Verified. That suite tests correct tool invocation through the Model Context Protocol. Think CI checks, ticket updates, and file edits in one loop. Long-context analysis is a fourth fit. The model accepts text, image, and video input. Documentation, screenshots, and a recorded repro can share one prompt. Marktechpost’s Interactive Explorer Kimi K2.7-Code — Interactive Explorer Company-reported benchmarks and official API pricing. Released June 12, 2026. Verified June 12, 2026. Benchmarks Cost Calculator Specs Source: Moonshot AI Kimi K2.7-Code model card. K2.7-Code ran in Kimi Code CLI; GPT-5.5 in Codex xhigh; Claude Opus 4.8 in Claude Code xhigh. First-party numbers, not an independent leaderboard. Input tokens / run: 50,000 Output tokens / run: 8,000 Cache hit rate: 50% Runs / month: 1,000 Reasoning share of output: 40% Input cost$0.00 Output cost$0.00 Est. monthly total$0.00 $0.00 Rates: cached input $0.19 / 1M, cache-miss input $0.95 / 1M, output $4.00 / 1M (official Kimi pricing). Savings line illustrates K2.7-Code’s reported ~30% lower reasoning-token usage vs K2.6, applied to the reasoning share of output. Estimate only. Source: Kimi K2.7-Code Hugging Face model card and Kimi API docs. ‘; models.forEach(function(m){ h+=’ ‘ +’ ‘+m.name+’ ‘ +’ ‘; }); wrap.innerHTML=h;charts.appendChild(wrap); }); function renderBars(){ benches.forEach(function(b,i){ models.forEach(function(m){ var el=root.querySelector(‘#f-‘+i+’-‘+m.key); var parent=el.closest(‘.k27-row’); if(!active[m.key]){parent.style.display=’none’;el.style.width=’0′;return;} parent.style.display=’flex’; el.style.width=b[m.key]+’%’; el.textContent=b[m.key].toFixed(1); }); }); } setTimeout(renderBars,60); // —- specs —- var sp=root.querySelector(‘#k27-specs’); specs.forEach(function(s){ var d=document.createElement(‘div’);d.className=’k27-spec’; d.innerHTML=’ ‘+s[0]+’ ‘+s[1]+’ ‘; sp.appendChild(d); }); // —- calculator —- var R_CACHE=0.19, R_MISS=0.95, R_OUT=4.00; // per 1M tokens function fmt(n){return ‘$’+n.toLocaleString(‘en-US’,{minimumFractionDigits:2,maximumFractionDigits:2});} function comma(n){return n.toLocaleString(‘en-US’);} var I={inp:root.querySelector(‘#k27-in’),out:root.querySelector(‘#k27-out’), cache:root.querySelector(‘#k27-cache’),runs:root.querySelector(‘#k27-runs’), think:root.querySelector(‘#k27-think’)}; function calc(){ var inp=+I.inp.value, out=+I.out.value, cache=+I.cache.value/100, runs=+I.runs.value, think=+I.think.value/100; root.querySelector(‘#k27-in-v’).textContent=comma(inp); root.querySelector(‘#k27-out-v’).textContent=comma(out); root.querySelector(‘#k27-cache-v’).textContent=(cache*100).toFixed(0)+’%’; root.querySelector(‘#k27-runs-v’).textContent=comma(runs); root.querySelector(‘#k27-think-v’).textContent=(think*100).toFixed(0)+’%’; var inRate=cache*R_CACHE+(1-cache)*R_MISS; var inCost=runs*inp*inRate/1e6; var outCost=runs*out*R_OUT/1e6; var total=inCost+outCost; // illustrative 30% reasoning-token reduction on the reasoning share of output var reasonOut=out*think; var saved=runs*(reasonOut*0.30)*R_OUT/1e6; root.querySelector(‘#k27-r-in’).textContent=fmt(inCost); root.querySelector(‘#k27-r-out’).textContent=fmt(outCost); root.querySelector(‘#k27-r-total’).textContent=fmt(total); root.querySelector(‘#k27-r-big’).textContent=fmt(total)+’ /mo’; root.querySelector(‘#k27-r-save’).innerHTML= ‘≈ ‘+fmt(saved)+’/mo saved vs K2.6-style reasoning, from ~30% fewer reasoning tokens.’; } Object.keys(I).forEach(function(k){I[k].addEventListener(‘input’,calc);}); calc(); })();

Moonshot AI Releases Kimi K2.7-Code: a Coding Model Reporting +21.8% on Kimi Code Bench v2 Over K2.6 Read Post »

AI, Committee, News, Uncategorized

A Coding Implementation on Spatial Graph Neural Networks for Urban Function Inference Using city2graph, OSMnx, and PyTorch Geometric

In this tutorial, we build an end-to-end spatial graph learning pipeline using city2graph. We start by collecting real urban POI data and street network information from OpenStreetMap, with a synthetic fallback to ensure the workflow remains reliable. We then engineer spatial features, construct multiple proximity graph families, and compare how different graph-building strategies represent the same urban environment. After that, we create both heterogeneous and homogeneous graph structures, convert them into PyTorch Geometric format, and train a GraphSAGE model to predict POI categories from spatial structure. Through this process, we integrate geospatial data processing, graph construction, and GNN-based urban function inference into a single practical workflow. Installing city2graph and Importing Geospatial and Graph Learning Libraries Copy CodeCopiedUse a different Browser !pip -q install “city2graph[cpu]” osmnx contextily scikit-learn 2>/dev/null import warnings, numpy as np, pandas as pd, geopandas as gpd warnings.filterwarnings(“ignore”) from shapely.geometry import Point import matplotlib.pyplot as plt import city2graph as c2g print(“city2graph version:”, getattr(c2g, “__version__”, “unknown”)) print(“PyTorch / PyG available:”, c2g.is_torch_available()) import torch import torch.nn.functional as F from torch_geometric.nn import SAGEConv, to_hetero from torch_geometric.utils import to_undirected from sklearn.preprocessing import StandardScaler from sklearn.neighbors import NearestNeighbors from sklearn.metrics import accuracy_score, f1_score from sklearn.decomposition import PCA SEED = 42 np.random.seed(SEED); torch.manual_seed(SEED) We begin by installing the required libraries and importing the geospatial, graph learning, and machine learning tools used throughout the tutorial. We verify that city2graph and PyTorch Geometric are available so the rest of the workflow can run properly. We also set a fixed random seed to make the graph construction, training split, and model results more reproducible. Collecting OpenStreetMap POI Data with a Synthetic Fallback Copy CodeCopiedUse a different Browser CENTER = (35.6595, 139.7005) DIST_M = 1100 TAG_QUERIES = { “food”: {“amenity”: [“restaurant”, “cafe”, “fast_food”, “bar”, “pub”]}, “retail”: {“shop”: True}, “education”: {“amenity”: [“school”, “university”, “college”, “kindergarten”, “library”]}, “health”: {“amenity”: [“hospital”, “clinic”, “pharmacy”, “doctors”, “dentist”]}, } def to_points(gdf): g = gdf.copy() g[“geometry”] = g.geometry.representative_point() return g poi_gdf, segments_gdf = None, None try: import osmnx as ox ox.settings.use_cache = True ox.settings.log_console = False frames = [] for label, tags in TAG_QUERIES.items(): try: f = ox.features_from_point(CENTER, tags=tags, dist=DIST_M) f = f[f.geometry.notna()] if len(f): f = to_points(f)[[“geometry”]].copy() f[“category”] = label frames.append(f) except Exception as e: print(f” (skip {label}: {e})”) if not frames: raise RuntimeError(“No POIs returned from Overpass.”) poi_gdf = gpd.GeoDataFrame(pd.concat(frames, ignore_index=True), crs=”EPSG:4326″) G = ox.graph_from_point(CENTER, dist=DIST_M, network_type=”walk”) segments_gdf = ox.graph_to_gdfs(G, nodes=False, edges=True).reset_index(drop=True)[[“geometry”]] print(f”OSM acquisition OK -> {len(poi_gdf)} POIs, {len(segments_gdf)} street segments”) except Exception as e: print(f”OSM unavailable ({e}) -> generating synthetic clustered POIs.”) rng = np.random.default_rng(SEED) cats = list(TAG_QUERIES.keys()) centers = rng.uniform(-0.01, 0.01, size=(8, 2)) + np.array(CENTER[::-1]) rows = [] for ci, c in enumerate(centers): dom = cats[ci % len(cats)] n = rng.integers(40, 90) pts = c + rng.normal(0, 0.0016, size=(n, 2)) for (lon, lat) in pts: cat = dom if rng.random() < 0.75 else rng.choice(cats) rows.append({“geometry”: Point(lon, lat), “category”: cat}) poi_gdf = gpd.GeoDataFrame(rows, crs=”EPSG:4326″) segments_gdf = None print(f”Synthetic dataset -> {len(poi_gdf)} POIs”) if len(poi_gdf) > 700: poi_gdf = poi_gdf.sample(700, random_state=SEED).reset_index(drop=True) metric_crs = poi_gdf.estimate_utm_crs() poi_gdf = poi_gdf.to_crs(metric_crs).reset_index(drop=True) if segments_gdf is not None: segments_gdf = segments_gdf.to_crs(metric_crs) print(“Class balance:n”, poi_gdf[“category”].value_counts()) We collect real POI data from OpenStreetMap around Shibuya, Tokyo, and group the locations into broad urban function categories such as food, retail, education, and health. We also download the walkable street network so that the POIs can later be connected with urban-form features. If the OSM request fails, we generate a synthetic clustered dataset, which keeps the tutorial runnable even when online data access is unavailable. Engineering Spatial Features and Building Proximity Graph Families Copy CodeCopiedUse a different Browser poi_gdf[“cx”] = poi_gdf.geometry.x poi_gdf[“cy”] = poi_gdf.geometry.y coords = poi_gdf[[“cx”, “cy”]].to_numpy() nn = NearestNeighbors(radius=150.0).fit(coords) poi_gdf[“local_density”] = [len(idx) – 1 for idx in nn.radius_neighbors(coords, return_distance=False)] if segments_gdf is not None and len(segments_gdf): try: joined = gpd.sjoin_nearest(poi_gdf[[“geometry”]], segments_gdf[[“geometry”]], distance_col=”dist_street”) poi_gdf[“dist_street”] = joined.groupby(level=0)[“dist_street”].min().reindex(poi_gdf.index).fillna(0.0) except Exception: poi_gdf[“dist_street”] = 0.0 else: poi_gdf[“dist_street”] = 0.0 poi_gdf[“category”] = poi_gdf[“category”].astype(“category”) poi_gdf[“label”] = poi_gdf[“category”].cat.codes.astype(int) CLASS_NAMES = list(poi_gdf[“category”].cat.categories) print(“Classes:”, CLASS_NAMES) def graph_stats(name, builder): try: nodes, edges = builder() deg = pd.Series(np.r_[edges.index.get_level_values(0), edges.index.get_level_values(1)]).value_counts() return name, len(edges), round(deg.mean(), 2), (nodes, edges) except Exception as e: return name, f”ERR: {e}”, None, None builders = { “KNN (k=8)”: lambda: c2g.knn_graph(poi_gdf, distance_metric=”euclidean”, k=8, as_nx=False), “Delaunay”: lambda: c2g.delaunay_graph(poi_gdf, as_nx=False), “Gabriel”: lambda: c2g.gabriel_graph(poi_gdf, as_nx=False), “RNG”: lambda: c2g.relative_neighborhood_graph(poi_gdf, as_nx=False), “EMST”: lambda: c2g.euclidean_minimum_spanning_tree(poi_gdf, as_nx=False), “Waxman”: lambda: c2g.waxman_graph(poi_gdf, distance_metric=”euclidean”, r0=150, beta=0.6), } print(“n— Proximity graph comparison —“) print(f”{‘graph’:<14}{‘#edges’:>10}{‘avg_degree’:>12}”) built = {} for nm, b in builders.items(): name, ne, avgdeg, payload = graph_stats(nm, b) print(f”{name:<14}{str(ne):>10}{str(avgdeg):>12}”) if payload: built[nm] = payload fig, axes = plt.subplots(1, 3, figsize=(16, 5)) for ax, key in zip(axes, [“KNN (k=8)”, “Delaunay”, “EMST”]): if key in built: n_, e_ = built[key] e_.plot(ax=ax, linewidth=0.4, color=”#3b7dd8″, alpha=0.6) poi_gdf.plot(ax=ax, markersize=4, color=”#d83b5c”) ax.set_title(key); ax.set_axis_off() plt.suptitle(“Spatial graph topologies on the same POI set”, y=1.02) plt.tight_layout(); plt.show() We engineer spatial features for each POI by extracting its projected coordinates, calculating local density, and estimating distance to the nearest street segment. We then assign category labels and build several families of proximity graphs, including KNN, Delaunay, Gabriel, RNG, EMST, and Waxman. We compare their edge counts and average degrees, then visualize selected graph topologies to see how differently they connect the same set of POIs. Constructing Heterogeneous and Homogeneous Graphs in PyTorch Geometric Copy CodeCopiedUse a different Browser nodes_dict = {} for cat in CLASS_NAMES: sub = poi_gdf[poi_gdf[“category”] == cat].copy().reset_index(drop=True) nodes_dict[cat] = sub[[“geometry”, “cx”, “cy”, “local_density”]] try: _, bridge_edges = c2g.bridge_nodes(nodes_dict, proximity_method=”knn”, k=3, distance_metric=”euclidean”) hetero = c2g.gdf_to_pyg( nodes_dict, bridge_edges, node_feature_cols={cat: [“cx”, “cy”, “local_density”] for cat in CLASS_NAMES}, ) print(“nHeteroData node types:”, hetero.node_types) print(“HeteroData edge types:”) for et in hetero.edge_types: print(f” {et}: {hetero[et].edge_index.shape[1]} edges”) except Exception as e: hetero = None print(“Heterogeneous build skipped:”, e) nodes, edges = c2g.knn_graph(poi_gdf, distance_metric=”euclidean”, k=8, as_nx=False) deg = pd.Series(np.r_[edges.index.get_level_values(0), edges.index.get_level_values(1)]).value_counts() nodes[“degree”] = deg.reindex(nodes.index).fillna(0).astype(float) for col in [“cx”, “cy”, “local_density”, “dist_street”, “label”]: if col not in nodes.columns: nodes[col] = poi_gdf.loc[nodes.index, col].values FEATS = [“cx”, “cy”, “local_density”, “dist_street”, “degree”] nodes[FEATS] = StandardScaler().fit_transform(nodes[FEATS].astype(float)) data = c2g.gdf_to_pyg(nodes, edges, node_feature_cols=FEATS, node_label_cols=[“label”]) data.edge_index = to_undirected(data.edge_index) data.x = data.x.float() y = data.y.long().view(-1) N, num_classes = data.num_nodes, int(y.max()) + 1 print(f”nHomogeneous Data: {N} nodes, {data.edge_index.shape[1]} directed-edges, ” f”{data.x.shape[1]} features, {num_classes} classes”) We construct

A Coding Implementation on Spatial Graph Neural Networks for Urban Function Inference Using city2graph, OSMnx, and PyTorch Geometric Read Post »

AI, Committee, News, Uncategorized

You do your own time

There we were, a regular murderers’ row of librarians. Little Jo. Eustace. And me. Turning around in the nave of our library to greet the sound of footsteps, pistols leveled in case whoever was coming in didn’t respect sanctuary. Little Jo had a stack of books under one arm. Eustace was holding the screwdriver she’d been using to tune the aneroid barometer. Eustace had painted height lines on the big double doorframe, as only half a joke. When the wanderer paused, outlined within, the eiroscope and I both registered that they were exactly five feet, ten inches. With their Cool Hand Luke hat on.  They paused, boots scattering sand on the threshold. A narrow straight-hipped silhouette against the white noon light falling from the white, white sky. The doors had been open to catch a breath of wind, but there wasn’t any. So when the stranger swayed, it wasn’t from the gale.  “Sanctuary,” they croaked, and remeasured their length onto the rug between the smoothed trunks that held the loft up. The Stetson went rolling. Little Jo dropped her stack of books and her pistol and dashed forward. I jumped at the noise but holstered my own shooter in case I came to need it. We each grabbed an armpit and dragged the outlaw’s feet inside the threshold, grunting, lickety-split. I slipped their floppy pack off, empty metal water bottles clanking as I set it aside. Eustace helped us roll them, and I laid the soft of my wrist on their head. Hot as Hades, but still tacky. Moist enough that my skin gave a reluctant pop when I lifted my arm. Not past saving.  “Let’s get them someplace cool,” I said. “Little Jo, go empty out the ice machine.” Eustace and I toted our fugitive down to the cellar, using the rug as a stretcher. It was Diné, vermilion with black and gray, and I was glad they hadn’t thrown up on it. Though that wool had seen worse. Mehitabel, the black cat, watched us from atop the timber lintel of the cellar access. Her tail tip flicked incuriously. She was on pack rat watch. Aloof from human antics. The cellar was narrow, low, and stocked with Eustace’s blue corn lager in bottles, prickly pear jam, potatoes, and the few hard-rind squash still left over. The mud walls were whitewashed, and while it wasn’t quite cool, it was better than the outside. We stripped off the stranger’s clothes, trying to slit along the seams so we could repair them later. City stuff, mass-produced and machine-woven. Little Jo brought the ice and went back upstairs to watch alongside the eiroscope in case pursuit was close behind. The stranger’s eyes flew open, and they screamed when I packed wet cold pillowcases against their pink bits. Eustace had to hold their battling hands away from their genitals until they settled.  Those were good signs. Brown eyes blinked between heavy creases. “What the hell—” “I’m Ponyboy,” I told them. “She. PhD. I’m one of the librarians here. This is Eustace. She, MLS.” They struggled to sit upright. “Shhh.” Eustace pushed them down and laid an ice-soaked cloth across their eyes. “You’re heat-sick.” “Sanctuary,” they whispered. “Did I say?” “You did. This is the Bōchord. You made it. Must have been a long walk.”  We continued packing ice around them—into their armpits now. They yelped and moaned but gave up fighting. “What’s your name?” “Guh—” Too long a pause to be believable. “Gibson. She.”  “Welcome to Judgement, Gibson,” I said. “Sorry about the cold, but it’s got to stay there for a little.” “My pack,” she said, shrilling. “My pack. I need it.” “It’s safe,” Eustace told her. “You just relax and we’ll get it for you.” When I came back out the nave was still and heavy in the heat, as if nothing had happened. Little Jo had turned one of the bumpy-backed wooden chairs to face the door and was sitting on it, hands buried in tiered skirt ruffles between her knees.  I looked left, two steps up into the sanctuary, but all was calm, the work I’d left—cataloguing—still heaped on the blond wood altar table. Behind it, bright primitive saints in shades of blue-green, scarlet, and yellow looked with shocked eyebrows down from the adobe wall.  I moved up behind Little Jo, making sure she could hear me coming. My footsteps echoed from roof joists made from entire peeled and waxed trees. Scrolled headers painted the color of good turquoise held them over the bookcases lining each long wall.  The Bōchord. Book Sanctuary. Nuestra Biblioteca del Perpetuo Socorro.  Population until this morning: three. “Any sign of trouble?” Little Jo turned her unambiguous jaw away, tendons rising on a long neck, jailhouse ink black-blue on her red-black skin. A sweaty curl escaped down her nape. My fingers itched to tidy it. But it hurt too much to even think about taking a risk that profound. She stretched horny discalced feet before her. Cracking calluses wrapped the balls and heels. “Only what we brung in with us.” She was a double murderer, but I couldn’t tell her I knew how she felt, because I hadn’t heard about her history from her. And her guilt wasn’t mine to absolve. You do your own time. Not anybody else’s.  “You check her bag for anything dangerous?” “She’s got an SSD.” Little Jo shrugged. “No threat if we don’t plug it into anything.” “The eiroscope got anything to say?” “I can speak for myself, Ponyboy,” said the eiroscope from the air all around. Actually it used the old wireless speakers tucked in the corners, but the effect was as of a choir of angels. Or an airport announcement you could actually understand. “I’ve been focused on the CubeSat launch.” I startled. “Shit. What time is it?” “Eleven forty-seven. The launch came off perfectly. Our last batch of sats are on their way.” Little Jo breathed deep and unfisted her hands from her skirts. There were so

You do your own time Read Post »

AI, Committee, News, Uncategorized

Moonshot AI Launches Kimi Work, a Local Desktop Agent Reportedly Running on Kimi K2.6 With a 300-Sub-Agent Agent Swarm

Moonshot AI has introduced Kimi Work, an AI agent that runs on your own desktop. The Beijing-based AI entity announced it this week along with downloads for macOS and Windows. Kimi Work reads local files, drives your real browser, and runs scheduled tasks. It targets knowledge workers whose bottleneck is access to files and live sessions. Most agent tools of the past two years ran in the cloud. You type a goal, a remote server spins up a sandbox, and a hosted browser acts. Kimi Work runs locally instead, reaching files and sessions you already use. What is Kimi Work? Kimi Work is a downloadable application, not a web chat. You give it goals in plain language, and it acts on your machine. Independent community mentions report that it runs on Kimi K2.6, Moonshot’s flagship model. K2.6 is an open-weight Mixture-of-Experts model released on April 20, 2026. It activates about 32 billion parameters per token. It carries a 256K-token context window for long, multi-step work. How Kimi Work Operates Four building blocks define the product. Knowing them helps you reason about what it can do. Agent Swarm: Kimi Work can run many sub-agents in parallel on your machine. According to Moonshot release, the swarm scales to 300 sub-agents. The system splits a task into parts, then coordinates the results. K2.6’s swarm is documented up to 4,000 coordinated steps. WebBridge: This browser extension lets the agent use a browser like a person. It searches, scrolls, extracts data, and fills forms across tabs. Because it uses your real session, it inherits your existing logins and cookies. Cron scheduling engine: A built-in scheduler runs jobs on a daily, hourly, or conditional basis. Per Moonshot, triggers include LLM agent calls and Python or shell scripts. A “Keep Computer Awake” toggle keeps overnight jobs from stalling. Local files and code: The agent reads folders you mount and runs Python in the background. According to Moonshot release, original files stay in place unless you approve a change. The desktop app also ships finance-specific data. It is pre-integrated with market data for A-shares, Hong Kong stocks, and US equities. According to Moonshot release, this removes the need for custom API setup. Finished research can convert into PowerPoint decks or Excel sheets. Use Cases With Examples Document triage: Point the agent at a folder of quarterly PDFs. Ask it to summarize them into one document, keeping originals intact. The swarm assigns one reader per file, then merges findings. Web data collection: Tell WebBridge to pull historical prices for three tickers. It opens your browser, sets the date range, and extracts the tables. Python then normalizes columns and writes an Excel workbook. Scheduled briefings: Define a 7:00 AM job in the cron engine. Each morning it gathers headlines and drafts a markdown briefing. With “Keep Computer Awake” on, the job survives overnight. Office generation: Ask for a short market-brief deck after a research pass. The agent drafts sections in parallel and renders native slides. Kimi Work vs Cloud Agents The core difference is where the agent runs and what it can reach. The table compares Kimi Work against a typical cloud agent. Dimension Kimi Work (local) Typical cloud agent Execution location Your desktop Vendor servers File access Mounts your local folders Uploaded or sandboxed files Browser Your real, logged-in browser via WebBridge Hosted virtual browser Scheduling Built-in cron engine Often external or limited Underlying model Kimi K2.6, reported Vendor’s hosted model Setup Install app, grant folder access Zero-install, open a tab Security responsibility Falls on the user Falls on the vendor Neither approach wins outright. Local execution keeps data on your device and reaches real files. Cloud execution trades that control for zero-setup convenience and managed safety. Scheduling: The Cron Engine in Practice Kimi Work is driven by natural language, not a public API. Its scheduler is a cron engine, so it accepts standard cron schedules. The five fields are: minute, hour, day-of-month, month, and day-of-week. Copy CodeCopiedUse a different Browser # Standard cron schedules the engine understands 0 7 * * * # every day at 07:00 0 * * * * # every hour, on the hour 30 8 * * 1-5 # 08:30 on weekdays only (Mon-Fri) 0 0 1 * * # 00:00 on the first day of each month You pair a schedule with a plain-language task. A daily briefing job reads like this. Copy CodeCopiedUse a different Browser Schedule: 0 7 * * * (every day at 07:00) Task: “Draft today’s market briefing and save it to ~/KimiWorkspace/briefing.md. Ask before writing.” The approval gate then applies to that write, and to any web action. Key Takeaways An “Ask before acting” gate, with YOLO mode off, prompts before any file write. Kimi Work is a local desktop agent for macOS (Apple silicon) and Windows. An Agent Swarm runs up to 300 sub-agents in parallel on your machine. WebBridge drives your logged-in browser; a built-in cron engine runs scheduled jobs. It reads local folders and runs Python, keeping originals unless you approve changes. Marktechpost’s Interactive Explainer <!– version with

Moonshot AI Launches Kimi Work, a Local Desktop Agent Reportedly Running on Kimi K2.6 With a 300-Sub-Agent Agent Swarm Read Post »

AI, Committee, News, Uncategorized

Inside interoception: The hidden sense of how you feel inside

MIT Technology Review Explains: Let our writers untangle the complex, messy world of science and technology to help you understand what’s coming next. You can read more from the series here. Your brain lives in the dark space of your skull. Yet it knows when the wind lifts the hairs on your skin, when your heart is racing, when your gut tightens with fear. It’s also, right now, predicting what you’ll read next as your eyes move across this page. It’s picking up signals that help it make sense of what’s happening around you and prepare you to act if you need to stay safe. You aren’t usually aware that your brain is doing all that. Our senses take in information at a staggering rate—roughly 11 million bits flood in every second from our skin, eyes, ears, and more. That’s nearly three paperback novels’ worth of data every second. Only a sliver reaches our conscious awareness.  Researchers estimate that our conscious minds can process roughly 10 to 60 bits of information per second, about the rate at which you’re reading this sentence. That’s a ratio of about one conscious bit to hundreds of thousands of unconscious bits. And that’s a mercy. As Moriah Thomason, a neuroscientist at NYU Langone, says, “Thank goodness we’re built like this. There’s a layer of what we have access to in conscious awareness. And then we have a right-under-the-surface amount. There is only a certain amount we are meant to ‘hold in mind’ in order to function successfully.”  What you are aware of: Your stomach growling when you’re hungry. Your palms sweating before you speak in public. The breath you just took, if you pay attention to it. Even your heartbeat, which some people can sense from the inside without feeling their pulse in their wrist. Scientists have a word for how we sense ourselves from the inside: interoception.  The term was coined in 1906 by the British neurophysiologist Charles Sherrington. For most of the 20th century it remained largely confined to textbooks. Today, thanks to a 2021 Nobel Prize and new tools that can map the interoceptive system across the body, the study of this facility is suddenly quite hot. As researchers decode how signals move between body and brain, a clearer picture is starting to take shape—with implications for how we understand and treat conditions from obesity to chronic pain to anxiety. The field began to take off in the 1990s. In 1994, the neurologist Antonio Damasio published a book with a pointed title: Descartes’ Error. He challenged the historical separation of thinking and feeling, arguing that our ability to choose and act is driven by feelings, and those feelings in turn are shaped by the body’s signals, such as your gut clenching or your skin going clammy. When we lose that connection between feeling and thinking, as one of Damasio’s patients did after surgery to treat a brain tumor, we may still be able to reason with perfect logic about the pros and cons of traveling on a Tuesday or a Wednesday. But without the emotional signals that help us predict what a choice will feel like, our reason spins and circles, and we cannot decide. A contemporary of Damasio’s, the neuroscientist Bud Craig, spent his career asking one question: How do you feel? He charted how the brain builds an inner map of the body and updates it in real time every moment you are alive. Think of the captain’s bridge on the USS Enterprise, where a live map displays the status of the ship’s critical systems: oxygen levels, energy availability, hull integrity, shield strength. Another set of indicators senses things outside the ship: asteroid belts, enemy ships, radiation, life signs, and spatial anomalies not yet understood. Your brain, only about the size of your two fists pressed together, creates a map like this for your entire body, along with a map of the outside world, from data streaming in through your five senses. Together, they feed into your brain’s working model of you in the world, now and across time—where you are, who you are, your expectations for what’s about to happen (based on everything you know), and what all that means for you. When someone asks “How are you doing?” we consult our maps and report back on our status. We might say we’re happy, depleted, anxious, or energetic. These feelings are always a braid of emotional and physical sensations. They’re what your interoceptive navigational system serves up to your awareness when you sense yourself from the inside. As we grow up, we learn to interpret what these sensations mean—interpretations that, in turn, can alter our physiology, emotions, and behavior. Research by the psychologist Alia Crum shows that people who embrace a “stress is enhancing” mindset produce more growth hormones than people who have a “stress is debilitating” mindset. They also experience more positive emotions and greater cognitive flexibility. Language also matters. We learn words for the textures of our feelings—words that then shape how we feel and act. People low in emotional “granularity”—as the psychologist Marc Brackett calls the ability to distinguish between closely related feelings—react more impulsively under stress and are less able to find meaning in difficult experiences. But mindsets and emotional intelligence are malleable. We can learn that “anxious” is different from “terrified,” and we can even reframe how we interpret our body’s sensations. Instead of thinking of the butterflies in our bellies as annoying, we can welcome them as our body’s way of preparing us for a peak performance. Scientists have long understood that the interoceptive information informing these lived experiences travels via two major systems: nerves and humors (blood and lymph). Now they’re actively studying a third system—the “interstitium,” a network of fluid-filled spaces woven throughout the body’s connective fascia that may also play a role in communication. But until recently, scientific understanding of this interoceptive system looked like a high-level schematic that left out vital details—how information travels from the outside environment in,

Inside interoception: The hidden sense of how you feel inside Read Post »

AI, Committee, News, Uncategorized

The Download: “reprogramming” aging, and the hidden sense of interoception

This is today’s edition of The Download, our weekday newsletter that provides a daily dose of what’s going on in the world of technology. Why “reprogramming” is the buzziest approach to reversing aging right now Earlier this week, Life Biosciences, a biotech company focused on reversing age-related diseases, announced that it had dosed its first volunteer. A person with glaucoma has had an experimental treatment injected straight into their eyeball. The idea is to treat the disease by regenerating healthy nerves in the eye—but the company already hopes to go further. If the treatment can reverse glaucoma, similar treatments could reverse other diseases of aging. Maybe, just maybe, they could reverse aging altogether. The approach relies on “reprogramming” cells to a younger state. It’s one of many strategies being explored by biotech companies looking to slow and reverse aging. But of all of them, it seems to be the one that is truly taking off. Read the full story on the pursuit of reprogramming for rejuvenation. —Jessica Hamzelou This story is from The Checkup, our weekly newsletter giving you the inside track on all things biotech. Sign up to receive it in your inbox every Thursday. Inside Interoception: The hidden sense of how you feel inside Scientists have a word for how we sense ourselves from the inside: interoception. Today, thanks to a 2021 Nobel Prize and new tools that can map internal signaling across the body, research into interoception is taking off. As researchers decode how signals move between body and brain, a clearer picture is starting to take shape—with implications for how we understand and treat conditions from obesity to chronic pain to anxiety. Find out how it’s leading to a “new continent of awareness.” —Katherine W. Isaacs This story is part of MIT Technology Review Explains, our series untangling the complex, messy world of technology to help you understand what’s coming next. You can read more from the series here.  The must-reads I’ve combed the internet to find you today’s most fun/important/scary/fascinating stories about technology. 1 SpaceX has officially delivered the largest IPO in historyIt’s raised a record $75 billion at a $1.77 trillion valuation. (Axios)+ Making Elon Musk the world’s first trillionaire (on paper). (Reuters $)+ The IPO will now put his “extreme ownership” to the test. (Wired $)+ While China attempts to build a Starlink rival. (Rest of World)+ And other challenges to SpaceX emerge. (MIT Technology Review) 2 Jeff Bezos wants to build an “artificial general engineer”Through his new industrial AI startup, Prometheus. (NYT $)+ Which just raised $12 billion, valuing it at $41 billion. (TechCrunch)+ Meanwhile, OpenAI is building a fully automated researcher. (MIT Technology Review) 3 Chinese regulators are dramatically intensifying tech enforcementA spell of relative restraint has ended. (SCMP)+ Regulators have admonished e-commerce giants Alibaba and JD.com. (FT $)+ And blocked Meta’s acquisition of Chinese AI startup Manus. (BBC) 4 Google says Chinese cybercriminals used Gemini to scam AmericansIt’s suing the network over the alleged AI-powered scams.(NYT $)+ “Supercharged scams” are one of our 10 Things That Matter in AI Right Now. (MIT Technology Review) 5 Ukraine’s defense AI chief predicts a “new paradigm” of warfareHe expects AI systems to unify into a single battlefield network. (Reuters $)+ AI chatbots could be used for targeting decisions. (MIT Technology Review) 6 Anthropic has rankled users with its safety-first Fable modelStringent safety rules and refusals to help have sparked a backlash. (NBC)+ Anthropic has backtracked on some policies. (Wired $) 7 Pokémon Go data trained AI that could assist military dronesIt could help them locate themselves in war zones. (Guardian)+ Pokémon Go data is also training delivery robots. (MIT Technology Review) 8 Orbital data centers are harder than Silicon Valley thinksShedding heat in space requires ingenious new designs. (IEEE Spectrum)+ We need a few things to put data centers in space. (MIT Technology Review) 9 A toy universe shows time could be a quantum illusionIt could emerge from quantum interactions, rather than just existing by default. (New Scientist $) 10 Chatbots keep telling stories about a lighthouse keeper called EllaAnd now we may finally know why. (404 Media) Quote of the day “People are paying a trillion dollars for Elon.”  —Ross Gerber, the CEO of Gerber Kawasaki, which owns SpaceX stock, tells the New York Times why he believes the company’s IPO is overvalued. One More Thing GEORGE WYLESOL How generative AI could reinvent what it means to play I was immediately attracted to open-world games, in which you’re free to explore a vast simulated world and choose what challenges to accept. To make them feel alive, these games are inhabited by crowds of “nonplayer characters” (NPCs). But the illusion starts to weaken when you spend enough time with them. It may not always be like that. Just as it’s upending other industries, generative AI is opening the door to entirely new kinds of in-game interactions that are open-ended, creative, and unexpected. The game may not always have to end. Discover how generative AI could make games—and other worlds—deeply immersive. —Niall Firth We can still have nice things A place for comfort, fun, and distraction to brighten up your day. (Got any ideas? Drop me a line.) + My feet have fallen for the Crocs x Super Mario collection.+ Denmark’s 2026 Mullet Championship is the hottest hairdo contest of the year.+ Hungry at half-time? Here are seven mouth-watering international recipes inspired by the World Cup.+ Feast your eyes on a helicopter bound for Mars and a flowery Milky Way frame in Nature’s top images from last month.

The Download: “reprogramming” aging, and the hidden sense of interoception Read Post »

AI, Committee, News, Uncategorized

Why China is betting on big nuclear reactors

It’s a tale of two nuclear industries. In China, large reactors are coming together at a stunning pace. The country has nearly doubled its nuclear fleet since 2016, reaching nearly 60 gigawatts of total power capacity. The new facilities are nearly all gigawatt-scale pressurized-water reactors. Meanwhile, the US has built just two reactors in that time—Unit 3 and Unit 4 at Plant Vogtle in Georgia. Smaller reactors are attracting a lot of excitement and investment, though. A microreactor developer just saw its reactor reach criticality in a new Department of Energy pilot program. The world is racing to meet rising electricity demand, and many countries are interested in energy sources, like nuclear power, that don’t come with greenhouse-gas emissions. The key question: Which of these strategies will really pay off in terms of getting electrons on the grid quickly?   Today, the US and France are known as leaders in the nuclear industry. The US has the world’s largest fleet, with France coming in second. France is heavily dependent on nuclear for its grid—about two-thirds of the country’s power comes from nuclear reactors. But they have hardly added any new reactors to their fleets in recent years. The US can point only to Vogtle, and France connected its latest reactor to the grid in December 2024—the first in over 20 years.  It’s incredibly difficult to build the massive projects that dominate the nuclear industry today. Up-front investment can run well into the billions, so investors need to wait decades to break even. Designs are complex and can often change during the regulatory process, tacking on cost and time.  Many are hoping that the key to turning things around in these countries could be smaller reactors. The idea is that shrinking the footprint of a reactor cuts down the initial investment needed to prove out the new technology. The reactors could even be put together in a factory rather than being built on-site, allowing for a lower price over time. These smaller reactors are the target of tons of interest and investment in the US, including a new Department of Energy pilot program. The department set a goal last year of having three test reactors reach criticality by July 4, 2026, the nation’s 250th anniversary. (Criticality is the point at which a reactor achieves a self-sustaining chain reaction that can release energy.) Last week, California-based Antares hit the milestone with its Mark-0 reactor.  The company plans to eventually build microreactors, designed to produce between 100 kilowatts and 1 megawatt of electricity (large reactors on the grid today are at least 1,000 times that size). The core design is a sodium-cooled reactor, and it uses TRISO fuel, self-contained graphite-coated spheres of a more concentrated fuel than what most reactors use today.  But there is still a long way to go before it can actually produce power—the Mark-0 doesn’t have any power conversion or heat removal systems. The company plans to produce electricity in late 2027 and deploy in the field by 2028, CEO Jordan Bramble told the Associated Press. The private sector is interested—and invested—too. Big Tech companies are throwing money at new reactors they hope can help power data centers.  But look to the other side of the globe, and others are sticking with the established blueprint: China is absolutely churning out large nuclear reactors. Construction started on six new reactors there in 2025, and two more got underway in the first five months of 2026. The country is on course to overtake both the US and the European Union in installed nuclear capacity by 2030. The speed here is staggering. As of 2024, the average time to build a new reactor in China came in at between five and seven years. The global average is about nine years, and the two most recent reactors in the US took about 15 years. One key to this speed is standardization: China has set up a uniform project management system to design, license, and build new reactors. They’re built in batches of six or more to take advantage of economies of scale. It’s one of the ideas meant to give the edge to smaller reactors, but China is working to realize the same benefits for larger projects. A huge amount of government investment is certainly helping. Larger reactors generally provide more electricity to the grid for a lower price, a key consideration in view of China’s steeply increasing electricity demand. While smaller reactors require less up-front investment than larger ones because of their size, they’ll actually be more expensive per unit of electricity produced.  That’s not to say China is exclusively focused on big reactors: the country is also expected to see its first operational small modular reactor, the Linglong-1, start sending power to the grid this year. But looking ahead, it’ll be interesting to see if smaller reactors can help the West keep building new nuclear power. At the moment, with China’s quick progress, it’s looking as if bigger might just be better.  This article is from The Spark, MIT Technology Review’s weekly climate newsletter. To receive it in your inbox every Wednesday, sign up here. 

Why China is betting on big nuclear reactors Read Post »

AI, Committee, News, Uncategorized

Inside soccer’s data renaissance

Imagine tuning in to the opening kickoff of a World Cup match and seeing a player intentionally send the ball all the way down the pitch and right out of bounds on the opponent’s end. Casual fans might scratch their heads. Where’s the logic in surrendering possession seconds into a game? If you were Jesse Davis, though, you’d know that this play could be a prime setup to score.  Davis is a professor of computer science at KU Leuven in Belgium and head of its Sports Analytics Lab, which has been at the vanguard of a data awakening in soccer since its inception more than a decade ago. Though the research group brings machine-­learning models to bear on a variety of sports—including basketball, volleyball, and field hockey—nowhere is its impact felt more than on the soccer pitch.  Davis and his team of researchers employ advanced data analytics to reveal a range of (beg your pardon) game-changing findings that are shifting pro clubs’ decision-making. “His lab is the most influential sports analytics lab in soccer,” says Hugo Rios-Neto, data recruitment lead for Royal Sporting Club Anderlecht in Belgium. They’ve helped teams better evaluate their rosters, conceived ways to assess how efficient (or not) strategies are, and developed algorithms that uncover hidden tactical patterns. Like, for instance, the value of kicking the ball out of bounds close to the goal and letting your opponent throw it back into play—a move that’s been popping up in some of the world’s top leagues over the last few years. To make the statistical argument for this seemingly counterproductive move, Davis’s group built a training data set composed of more than 1.4 million passes and some 60,000 throw-ins—partly from the 2022 World Cup. They used tree ensemble models (essentially a mashup of decision trees) to simulate the tactic. The conclusion, which the researchers presented in a 2024 paper under the apt title “Boot it”: When the ball is in the middle third of the pitch, kicking it out of bounds on your opponents’ side of the field can put you within 10 actions (think passes and dribbles) of a goal. That can be a big deal in a game that has 1,500 or more actions per match and very little scoring. The idea, Davis explains, is that you’re setting yourself up to recover the ball in an advantageous situation. Beyond providing discrete game-day insights, Davis also occupies a unique niche in the world of sports analytics, where many clubs now hire their own internal data teams to maintain a competitive edge. He makes most of his research freely available via open-source analytics tools, but the academic life also affords him the freedom to tackle more complex problems—like standardizing in-game data, a project that will make it easier to parse game footage and come up with winning strategies.  Davis, 45, grew up in Wisconsin and spent his childhood enraptured by basketball and (American) football. Soccer was largely a nonentity to him until college, when the 2002 World Cup—in which Brazil famously swept the tournament—reeled him in. But the notion of going on to dissect the sport never crossed his mind. His doctoral studies in computer science at the University of Wisconsin–Madison had him working with radiologists to analyze mammography reports.  In October 2010, he joined KU Leuven as a computer science professor looking at the intersection of AI and health care, with a focus on monitoring athletic performance. His research team studied, for instance, combining things like heart rate with other metrics to determine whether someone was overtraining. They also dove into the biomechanics of running. The tactical and technical aspects of sports, and soccer specifically, became the subject of Davis’s professorial work when he hired Jan Van Haaren, an engineering student focused on artificial intelligence and a self-described soccer fanatic. He wondered if data analysis could be used to study things like passing, shooting, and ball progression—metrics the game was only just beginning to digitally crunch at the time.  Davis realized that machine learning and other artificial-intelligence tools lent themselves well to the complexity, fluidity, and speed of soccer. You need not be well versed in the moneyball-ization of pro sports to see that it’s relatively easy to apply deep statistical work to baseball or basketball. You can isolate actions like jump shots and assign value to ones taken close or far away. Soon a basketball coach realizes that a player who can’t make a layup, but shoots roughly as well from the three-point line as on mid-range jumpers, might as well go for the shot that gets more points.  Soccer, by comparison, seemed like a poor candidate for that kind of analysis. “The vast, vast majority of actions really don’t lead to the outcome of a goal or even a shot,” says Rios-Neto. “So it’s hard to elaborate or derive a winning strategy from the data.” But Van Haaren’s love of the sport, and Davis’s love of sports in general, inspired them to try. Over time, Davis realized that machine learning and other artificial-intelligence tools lent themselves well to the complexity, fluidity, and speed of soccer. In 2014, he officially stood up the Sports Analytics Lab.  With a stable of about 10 students and postdocs at any one time, the lab began laying what Van Haaren calls the “intellectual foundations of how the game is analyzed today.” The researchers picked apart in-game actions, and suddenly they were valuing ball possession, penalty-kick strategy (aim for the center), and the merits of long shots on goal (take them). “One of the trends that’s been in soccer over the last five to 10 years is that the number of long shots has dramatically increased,” says Davis. “What the data let you do is really quantify what the probabilities of those things are.” In the years since Davis and his team started untangling individual soccer tactics, their ideas have started to permeate clubs across Europe, like Belgium’s Club Brugge KV, as well as national soccer organizations in the

Inside soccer’s data renaissance Read Post »

We use cookies to improve your experience and performance on our website. You can learn more at Privacy Policy and manage your privacy settings by clicking Settings.

Privacy Preferences

You can choose your cookie settings by turning on/off each type of cookie as you wish, except for essential cookies.

Allow All
Manage Consent Preferences
  • Always Active

Save
en_US