YouZum

Committee

AI, Committee, Nachrichten, Uncategorized

A Coding Implementation to Establish Rigorous Prompt Versioning and Regression Testing Workflows for Large Language Models using MLflow

In this tutorial, we show how we treat prompts as first-class, versioned artifacts and apply rigorous regression testing to large language model behavior using MLflow. We design an evaluation pipeline that logs prompt versions, prompt diffs, model outputs, and multiple quality metrics in a fully reproducible manner. By combining classical text metrics with semantic similarity and automated regression flags, we demonstrate how we can systematically detect performance drift caused by seemingly small prompt changes. Along the tutorial, we focus on building a workflow that mirrors real software engineering practices, but applied to prompt engineering and LLM evaluation. Check out the FULL CODES here. Copy CodeCopiedUse a different Browser !pip -q install -U “openai>=1.0.0” mlflow rouge-score nltk sentence-transformers scikit-learn pandas import os, json, time, difflib, re from typing import List, Dict, Any, Tuple import mlflow import pandas as pd import numpy as np from openai import OpenAI from rouge_score import rouge_scorer import nltk from nltk.translate.bleu_score import sentence_bleu, SmoothingFunction from sentence_transformers import SentenceTransformer from sklearn.metrics.pairwise import cosine_similarity nltk.download(“punkt”, quiet=True) nltk.download(“punkt_tab”, quiet=True) if not os.getenv(“OPENAI_API_KEY”): try: from google.colab import userdata # type: ignore k = userdata.get(“OPENAI_API_KEY”) if k: os.environ[“OPENAI_API_KEY”] = k except Exception: pass if not os.getenv(“OPENAI_API_KEY”): import getpass os.environ[“OPENAI_API_KEY”] = getpass.getpass(“Enter OPENAI_API_KEY (input hidden): “).strip() assert os.getenv(“OPENAI_API_KEY”), “OPENAI_API_KEY is required.” We set up the execution environment by installing all required dependencies and importing the core libraries used throughout the tutorial. We securely load the OpenAI API key at runtime, ensuring credentials are never hard-coded in the notebook. We also initialize essential NLP resources to ensure the evaluation pipeline runs reliably across different environments. Copy CodeCopiedUse a different Browser MODEL = “gpt-4o-mini” TEMPERATURE = 0.2 MAX_OUTPUT_TOKENS = 250 ABS_SEM_SIM_MIN = 0.78 DELTA_SEM_SIM_MAX_DROP = 0.05 DELTA_ROUGE_L_MAX_DROP = 0.08 DELTA_BLEU_MAX_DROP = 0.10 mlflow.set_tracking_uri(“file:/content/mlruns”) mlflow.set_experiment(“prompt_versioning_llm_regression”) client = OpenAI() embedder = SentenceTransformer(“all-MiniLM-L6-v2”) EVAL_SET = [ { “id”: “q1”, “input”: “Summarize in one sentence: MLflow tracks experiments, runs, parameters, metrics, and artifacts.”, “reference”: “MLflow helps track machine learning experiments by logging runs with parameters, metrics, and artifacts.” }, { “id”: “q2”, “input”: “Rewrite professionally: ‘this model is kinda slow but it works ok.'”, “reference”: “The model is somewhat slow, but it performs reliably.” }, { “id”: “q3”, “input”: “Extract key fields as JSON: ‘Order 5531 by Alice costs $42.50 and ships to Toronto.'”, “reference”: ‘{“order_id”:”5531″,”customer”:”Alice”,”amount_usd”:42.50,”city”:”Toronto”}’ }, { “id”: “q4”, “input”: “Answer briefly: What is prompt regression testing?”, “reference”: “Prompt regression testing checks whether prompt changes degrade model outputs compared to a baseline.” }, ] PROMPTS = [ { “version”: “v1_baseline”, “prompt”: ( “You are a precise assistant.n” “Follow the user request carefully.n” “If asked for JSON, output valid JSON only.n” “User: {user_input}” ) }, { “version”: “v2_formatting”, “prompt”: ( “You are a helpful, structured assistant.n” “Respond clearly and concisely.n” “Prefer clean formatting.n” “User request: {user_input}” ) }, { “version”: “v3_guardrailed”, “prompt”: ( “You are a rigorous assistant.n” “Rules:n” “1) If user asks for JSON, output ONLY valid minified JSON.n” “2) Otherwise, keep the answer short and factual.n” “User: {user_input}” ) }, ] We define all experimental configurations, including model parameters, regression thresholds, and MLflow tracking settings. We construct the evaluation dataset and explicitly declare multiple prompt versions to compare and test for regressions. By centralizing these definitions, we ensure that prompt changes and evaluation logic remain controlled and reproducible. Copy CodeCopiedUse a different Browser def call_llm(formatted_prompt: str) -> str: resp = client.responses.create( model=MODEL, input=formatted_prompt, temperature=TEMPERATURE, max_output_tokens=MAX_OUTPUT_TOKENS, ) out = getattr(resp, “output_text”, None) if out: return out.strip() try: texts = [] for item in resp.output: if getattr(item, “type”, “”) == “message”: for c in item.content: if getattr(c, “type”, “”) in (“output_text”, “text”): texts.append(getattr(c, “text”, “”)) return “n”.join(texts).strip() except Exception: return “” smooth = SmoothingFunction().method3 rouge = rouge_scorer.RougeScorer([“rougeL”], use_stemmer=True) def safe_tokenize(s: str) -> List[str]: s = (s or “”).strip().lower() if not s: return [] try: return nltk.word_tokenize(s) except LookupError: return re.findall(r”bw+b”, s) def bleu_score(ref: str, hyp: str) -> float: r = safe_tokenize(ref) h = safe_tokenize(hyp) if len(h) == 0 or len(r) == 0: return 0.0 return float(sentence_bleu([r], h, smoothing_function=smooth)) def rougeL_f1(ref: str, hyp: str) -> float: scores = rouge.score(ref or “”, hyp or “”) return float(scores[“rougeL”].fmeasure) def semantic_sim(ref: str, hyp: str) -> float: embs = embedder.encode([ref or “”, hyp or “”], normalize_embeddings=True) return float(cosine_similarity([embs[0]], [embs[1]])[0][0]) We implement the core LLM invocation and evaluation metrics used to assess prompt quality. We compute BLEU, ROUGE-L, and semantic similarity scores to capture both surface-level and semantic differences in model outputs. It allows us to evaluate prompt changes from multiple complementary perspectives rather than relying on a single metric. Copy CodeCopiedUse a different Browser def evaluate_prompt(prompt_template: str) -> Tuple[pd.DataFrame, Dict[str, float], str]: rows = [] for ex in EVAL_SET: p = prompt_template.format(user_input=ex[“input”]) y = call_llm(p) ref = ex[“reference”] rows.append({ “id”: ex[“id”], “input”: ex[“input”], “reference”: ref, “output”: y, “bleu”: bleu_score(ref, y), “rougeL_f1”: rougeL_f1(ref, y), “semantic_sim”: semantic_sim(ref, y), }) df = pd.DataFrame(rows) agg = { “bleu_mean”: float(df[“bleu”].mean()), “rougeL_f1_mean”: float(df[“rougeL_f1”].mean()), “semantic_sim_mean”: float(df[“semantic_sim”].mean()), } outputs_jsonl = “n”.join(json.dumps(r, ensure_ascii=False) for r in rows) return df, agg, outputs_jsonl def log_text_artifact(text: str, artifact_path: str): mlflow.log_text(text, artifact_path) def prompt_diff(old: str, new: str) -> str: a = old.splitlines(keepends=True) b = new.splitlines(keepends=True) return “”.join(difflib.unified_diff(a, b, fromfile=”previous_prompt”, tofile=”current_prompt”)) def compute_regression_flags(baseline: Dict[str, float], current: Dict[str, float]) -> Dict[str, Any]: d_sem = baseline[“semantic_sim_mean”] – current[“semantic_sim_mean”] d_rouge = baseline[“rougeL_f1_mean”] – current[“rougeL_f1_mean”] d_bleu = baseline[“bleu_mean”] – current[“bleu_mean”] flags = { “abs_semantic_fail”: current[“semantic_sim_mean”] < ABS_SEM_SIM_MIN, “drop_semantic_fail”: d_sem > DELTA_SEM_SIM_MAX_DROP, “drop_rouge_fail”: d_rouge > DELTA_ROUGE_L_MAX_DROP, “drop_bleu_fail”: d_bleu > DELTA_BLEU_MAX_DROP, “delta_semantic”: float(d_sem), “delta_rougeL”: float(d_rouge), “delta_bleu”: float(d_bleu), } flags[“regression”] = any([flags[“abs_semantic_fail”], flags[“drop_semantic_fail”], flags[“drop_rouge_fail”], flags[“drop_bleu_fail”]]) return flags We build the evaluation and regression logic that runs each prompt against the evaluation set and aggregates results. We log prompt artifacts, prompt diffs, and evaluation outputs to MLflow, ensuring every experiment remains auditable. We also compute regression flags that automatically identify whether a prompt version degrades performance relative to the baseline. Check out the FULL CODES here. Copy CodeCopiedUse a different Browser print(“Running prompt versioning + regression testing with MLflow…”) print(f”Tracking URI: {mlflow.get_tracking_uri()}”) print(f”Experiment: {mlflow.get_experiment_by_name(‘prompt_versioning_llm_regression’).name}”) run_summary = [] baseline_metrics = None baseline_prompt = None baseline_df = None baseline_metrics_name = None with mlflow.start_run(run_name=f”prompt_regression_suite_{int(time.time())}”) as parent_run: mlflow.set_tag(“task”, “prompt_versioning_regression_testing”) mlflow.log_param(“model”, MODEL)

A Coding Implementation to Establish Rigorous Prompt Versioning and Regression Testing Workflows for Large Language Models using MLflow Beitrag lesen »

AI, Committee, Nachrichten, Uncategorized

FMBench: Adaptive Large Language Model Output Formatting

arXiv:2602.06384v1 Announce Type: new Abstract: Producing outputs that satisfy both semantic intent and format constraints is essential for deploying large language models in user-facing and system-integrated workflows. In this work, we focus on Markdown formatting, which is ubiquitous in assistants, documentation, and tool-augmented pipelines but still prone to subtle, hard-to-detect errors (e.g., broken lists, malformed tables, inconsistent headings, and invalid code blocks) that can significantly degrade downstream usability. We present FMBench, a benchmark for adaptive Markdown output formatting that evaluates models under a wide range of instruction-following scenarios with diverse structural requirements. FMBench emphasizes real-world formatting behaviors such as multi-level organization, mixed content (natural language interleaved with lists/tables/code), and strict adherence to user-specified layout constraints. To improve Markdown compliance without relying on hard decoding constraints, we propose a lightweight alignment pipeline that combines supervised fine-tuning (SFT) with reinforcement learning fine-tuning. Starting from a base model, we first perform SFT on instruction-response pairs, and then optimize a composite objective that balances semantic fidelity with structural correctness. Experiments on two model families (OpenPangu and Qwen) show that SFT consistently improves semantic alignment, while reinforcement learning provides additional gains in robustness to challenging Markdown instructions when initialized from a strong SFT policy. Our results also reveal an inherent trade-off between semantic and structural objectives, highlighting the importance of carefully designed rewards for reliable formatted generation. Code is available at: https://github.com/FudanCVL/FMBench.

FMBench: Adaptive Large Language Model Output Formatting Beitrag lesen »

AI, Committee, Nachrichten, Uncategorized

How to Design Production-Grade Mock Data Pipelines Using Polyfactory with Dataclasses, Pydantic, Attrs, and Nested Models

In this tutorial, we walk through an advanced, end-to-end exploration of Polyfactory, focusing on how we can generate rich, realistic mock data directly from Python type hints. We start by setting up the environment and progressively build factories for data classes, Pydantic models, and attrs-based classes, while demonstrating customization, overrides, calculated fields, and the generation of nested objects. As we move through each snippet, we show how we can control randomness, enforce constraints, and model real-world structures, making this tutorial directly applicable to testing, prototyping, and data-driven development workflows. Check out the FULL CODES here. Copy CodeCopiedUse a different Browser import subprocess import sys def install_package(package): subprocess.check_call([sys.executable, “-m”, “pip”, “install”, “-q”, package]) packages = [ “polyfactory”, “pydantic”, “email-validator”, “faker”, “msgspec”, “attrs” ] for package in packages: try: install_package(package) print(f”✓ Installed {package}”) except Exception as e: print(f”✗ Failed to install {package}: {e}”) print(“n”) print(“=” * 80) print(“SECTION 2: Basic Dataclass Factories”) print(“=” * 80) from dataclasses import dataclass from typing import List, Optional from datetime import datetime, date from uuid import UUID from polyfactory.factories import DataclassFactory @dataclass class Address: street: str city: str country: str zip_code: str @dataclass class Person: id: UUID name: str email: str age: int birth_date: date is_active: bool address: Address phone_numbers: List[str] bio: Optional[str] = None class PersonFactory(DataclassFactory[Person]): pass person = PersonFactory.build() print(f”Generated Person:”) print(f” ID: {person.id}”) print(f” Name: {person.name}”) print(f” Email: {person.email}”) print(f” Age: {person.age}”) print(f” Address: {person.address.city}, {person.address.country}”) print(f” Phone Numbers: {person.phone_numbers[:2]}”) print() people = PersonFactory.batch(5) print(f”Generated {len(people)} people:”) for i, p in enumerate(people, 1): print(f” {i}. {p.name} – {p.email}”) print(“n”) We set up the environment and ensure all required dependencies are installed. We also introduce the core idea of using Polyfactory to generate mock data from type hints. By initializing the basic dataclass factories, we establish the foundation for all subsequent examples. Copy CodeCopiedUse a different Browser print(“=” * 80) print(“SECTION 3: Customizing Factory Behavior”) print(“=” * 80) from faker import Faker from polyfactory.fields import Use, Ignore @dataclass class Employee: employee_id: str full_name: str department: str salary: float hire_date: date is_manager: bool email: str internal_notes: Optional[str] = None class EmployeeFactory(DataclassFactory[Employee]): __faker__ = Faker(locale=”en_US”) __random_seed__ = 42 @classmethod def employee_id(cls) -> str: return f”EMP-{cls.__random__.randint(10000, 99999)}” @classmethod def full_name(cls) -> str: return cls.__faker__.name() @classmethod def department(cls) -> str: departments = [“Engineering”, “Marketing”, “Sales”, “HR”, “Finance”] return cls.__random__.choice(departments) @classmethod def salary(cls) -> float: return round(cls.__random__.uniform(50000, 150000), 2) @classmethod def email(cls) -> str: return cls.__faker__.company_email() employees = EmployeeFactory.batch(3) print(“Generated Employees:”) for emp in employees: print(f” {emp.employee_id}: {emp.full_name}”) print(f” Department: {emp.department}”) print(f” Salary: ${emp.salary:,.2f}”) print(f” Email: {emp.email}”) print() print() print(“=” * 80) print(“SECTION 4: Field Constraints and Calculated Fields”) print(“=” * 80) @dataclass class Product: product_id: str name: str description: str price: float discount_percentage: float stock_quantity: int final_price: Optional[float] = None sku: Optional[str] = None class ProductFactory(DataclassFactory[Product]): @classmethod def product_id(cls) -> str: return f”PROD-{cls.__random__.randint(1000, 9999)}” @classmethod def name(cls) -> str: adjectives = [“Premium”, “Deluxe”, “Classic”, “Modern”, “Eco”] nouns = [“Widget”, “Gadget”, “Device”, “Tool”, “Appliance”] return f”{cls.__random__.choice(adjectives)} {cls.__random__.choice(nouns)}” @classmethod def price(cls) -> float: return round(cls.__random__.uniform(10.0, 1000.0), 2) @classmethod def discount_percentage(cls) -> float: return round(cls.__random__.uniform(0, 30), 2) @classmethod def stock_quantity(cls) -> int: return cls.__random__.randint(0, 500) @classmethod def build(cls, **kwargs): instance = super().build(**kwargs) if instance.final_price is None: instance.final_price = round( instance.price * (1 – instance.discount_percentage / 100), 2 ) if instance.sku is None: name_part = instance.name.replace(” “, “-“).upper()[:10] instance.sku = f”{instance.product_id}-{name_part}” return instance products = ProductFactory.batch(3) print(“Generated Products:”) for prod in products: print(f” {prod.sku}”) print(f” Name: {prod.name}”) print(f” Price: ${prod.price:.2f}”) print(f” Discount: {prod.discount_percentage}%”) print(f” Final Price: ${prod.final_price:.2f}”) print(f” Stock: {prod.stock_quantity} units”) print() print() We focus on generating simple but realistic mock data using dataclasses and default Polyfactory behavior. We show how to quickly create single instances and batches without writing any custom logic. It helps us validate how Polyfactory automatically interprets type hints to populate nested structures. Copy CodeCopiedUse a different Browser print(“=” * 80) print(“SECTION 6: Complex Nested Structures”) print(“=” * 80) from enum import Enum class OrderStatus(str, Enum): PENDING = “pending” PROCESSING = “processing” SHIPPED = “shipped” DELIVERED = “delivered” CANCELLED = “cancelled” @dataclass class OrderItem: product_name: str quantity: int unit_price: float total_price: Optional[float] = None @dataclass class ShippingInfo: carrier: str tracking_number: str estimated_delivery: date @dataclass class Order: order_id: str customer_name: str customer_email: str status: OrderStatus items: List[OrderItem] order_date: datetime shipping_info: Optional[ShippingInfo] = None total_amount: Optional[float] = None notes: Optional[str] = None class OrderItemFactory(DataclassFactory[OrderItem]): @classmethod def product_name(cls) -> str: products = [“Laptop”, “Mouse”, “Keyboard”, “Monitor”, “Headphones”, “Webcam”, “USB Cable”, “Phone Case”, “Charger”, “Tablet”] return cls.__random__.choice(products) @classmethod def quantity(cls) -> int: return cls.__random__.randint(1, 5) @classmethod def unit_price(cls) -> float: return round(cls.__random__.uniform(5.0, 500.0), 2) @classmethod def build(cls, **kwargs): instance = super().build(**kwargs) if instance.total_price is None: instance.total_price = round(instance.quantity * instance.unit_price, 2) return instance class ShippingInfoFactory(DataclassFactory[ShippingInfo]): @classmethod def carrier(cls) -> str: carriers = [“FedEx”, “UPS”, “DHL”, “USPS”] return cls.__random__.choice(carriers) @classmethod def tracking_number(cls) -> str: return ”.join(cls.__random__.choices(‘0123456789ABCDEFGHIJKLMNOPQRSTUVWXYZ’, k=12)) class OrderFactory(DataclassFactory[Order]): @classmethod def order_id(cls) -> str: return f”ORD-{datetime.now().year}-{cls.__random__.randint(100000, 999999)}” @classmethod def items(cls) -> List[OrderItem]: return OrderItemFactory.batch(cls.__random__.randint(1, 5)) @classmethod def build(cls, **kwargs): instance = super().build(**kwargs) if instance.total_amount is None: instance.total_amount = round(sum(item.total_price for item in instance.items), 2) if instance.shipping_info is None and instance.status in [OrderStatus.SHIPPED, OrderStatus.DELIVERED]: instance.shipping_info = ShippingInfoFactory.build() return instance orders = OrderFactory.batch(2) print(“Generated Orders:”) for order in orders: print(f”n Order {order.order_id}”) print(f” Customer: {order.customer_name} ({order.customer_email})”) print(f” Status: {order.status.value}”) print(f” Items ({len(order.items)}):”) for item in order.items: print(f” – {item.quantity}x {item.product_name} @ ${item.unit_price:.2f} = ${item.total_price:.2f}”) print(f” Total: ${order.total_amount:.2f}”) if order.shipping_info: print(f” Shipping: {order.shipping_info.carrier} – {order.shipping_info.tracking_number}”) print(“n”) We build more complex domain logic by introducing calculated and dependent fields within factories. We show how we can derive values such as final prices, totals, and shipping details after object creation. This allows us to model realistic business rules directly inside our test data generators. Copy CodeCopiedUse a different Browser print(“=” * 80) print(“SECTION 7: Attrs Integration”) print(“=” * 80) import attrs from polyfactory.factories.attrs_factory import AttrsFactory @attrs.define class BlogPost: title: str author: str content: str views: int = 0 likes: int = 0 published: bool = False published_at: Optional[datetime] = None tags: List[str] = attrs.field(factory=list) class BlogPostFactory(AttrsFactory[BlogPost]): @classmethod def title(cls) -> str: templates = [ “10 Tips for {}”,

How to Design Production-Grade Mock Data Pipelines Using Polyfactory with Dataclasses, Pydantic, Attrs, and Nested Models Beitrag lesen »

AI, Committee, Nachrichten, Uncategorized

Google AI Introduces PaperBanana: An Agentic Framework that Automates Publication Ready Methodology Diagrams and Statistical Plots

Generating publication-ready illustrations is a labor-intensive bottleneck in the research workflow. While AI scientists can now handle literature reviews and code, they struggle to visually communicate complex discoveries. A research team from Google and Peking University introduce new framework called ‘PaperBanana‘ which is changing that by using a multi-agent system to automate high-quality academic diagrams and plots. https://dwzhu-pku.github.io/PaperBanana/ 5 Specialized Agents: The Architecture PaperBanana does not rely on a single prompt. It orchestrates a collaborative team of 5 agents to transform raw text into professional visuals. https://dwzhu-pku.github.io/PaperBanana/ Phase 1: Linear Planning Retriever Agent: Identifies the 10 most relevant reference examples from a database to guide the style and structure. Planner Agent: Translates technical methodology text into a detailed textual description of the target figure. Stylist Agent: Acts as a design consultant to ensure the output matches the “NeurIPS Look” using specific color palettes and layouts. Phase 2: Iterative Refinement Visualizer Agent: Transforms the description into a visual output. For diagrams, it uses image models like Nano-Banana-Pro. For statistical plots, it writes executable Python Matplotlib code. Critic Agent: Inspects the generated image against the source text to find factual errors or visual glitches. It provides feedback for 3 rounds of refinement. Beating the NeurIPS 2025 Benchmark https://dwzhu-pku.github.io/PaperBanana/ The research team introduced PaperBananaBench, a dataset of 292 test cases curated from actual NeurIPS 2025 publications. Using a VLM-as-a-Judge approach, they compared PaperBanana against leading baselines. Metric Improvement over Baseline Overall Score +17.0% Conciseness +37.2% Readability +12.9% Aesthetics +6.6% Faithfulness +2.8% The system excels in ‘Agent & Reasoning’ diagrams, achieving a 69.9% overall score. It also provides an automated ‘Aesthetic Guideline’ that favors ‘Soft Tech Pastels’ over harsh primary colors. Statistical Plots: Code vs. Image Statistical plots require numerical precision that standard image models often lack. PaperBanana solves this by having the Visualizer Agent write code instead of drawing pixels. Image Generation: Excels in aesthetics but often suffers from ‘numerical hallucinations’ or repeated elements. Code-Based Generation: Ensures 100% data fidelity by using the Matplotlib library to render the final plot. Domain-Specific Aesthetic Preferences in AI Research According to the PaperBanana style guide, aesthetic choices often shift based on the research domain to match the expectations of different scholarly communities. Research Domain Visual ‘Vibe‘ Key Design Elements Agent & Reasoning Illustrative, Narrative, “Friendly” 2D vector robots, human avatars, emojis, and “User Interface” aesthetics (chat bubbles, document icons) Computer Vision & 3D Spatial, Dense, Geometric Camera cones (frustums), ray lines, point clouds, and RGB color coding for axis correspondence Generative & Learning Modular, Flow-oriented 3D cuboids for tensors, matrix grids, and “Zone” strategies using light pastel fills to group logic Theory & Optimization Minimalist, Abstract, “Textbook” Graph nodes (circles), manifolds (planes), and a restrained grayscale palette with single highlight colors Comparison of Visualization Paradigms For statistical plots, the framework highlights a clear trade-off between using an image generation model (IMG) versus executable code (Coding). Feature Plots via Image Generation (IMG) Plots via Coding (Matplotlib) Aesthetics Generally higher; plots look more “visually appealing” Professional and standard academic look Fidelity Lower; prone to “numerical hallucinations” or element repetition 100% accurate; strictly represents the raw data provided Readability High for sparse data but struggles with complex datasets Consistently high; handles dense or multi-series data without error Key Takeaways Multi-Agent Collaborative Framework: PaperBanana is a reference-driven system that orchestrates 5 specialized agents—Retriever, Planner, Stylist, Visualizer, and Critic—to transform raw technical text and captions into publication-quality methodology diagrams and statistical plots. Dual-Phase Generation Process: The workflow consists of a Linear Planning Phase to retrieve reference examples and set aesthetic guidelines, followed by a 3-round Iterative Refinement Loop where the Critic agent identifies errors and the Visualizer agent regenerates the image for higher accuracy. Superior Performance on PaperBananaBench: Evaluated against 292 test cases from NeurIPS 2025, the framework outperformed vanilla baselines in Overall Score (+17.0%), Conciseness (+37.2%), Readability (+12.9%), and Aesthetics (+6.6%). Precision-Focused Statistical Plots: For statistical data, the system switches from direct image generation to executable Python Matplotlib code; this hybrid approach ensures numerical precision and eliminates “hallucinations” common in standard AI image generators. Check out the Paper and Repo. Also, feel free to follow us on Twitter and don’t forget to join our 100k+ ML SubReddit and Subscribe to our Newsletter. Wait! are you on telegram? now you can join us on telegram as well. The post Google AI Introduces PaperBanana: An Agentic Framework that Automates Publication Ready Methodology Diagrams and Statistical Plots appeared first on MarkTechPost.

Google AI Introduces PaperBanana: An Agentic Framework that Automates Publication Ready Methodology Diagrams and Statistical Plots Beitrag lesen »

AI, Committee, Nachrichten, Uncategorized

Google AI Introduces PaperBanana: An Agentic Framework that Automates Publication Ready Methodology Diagrams and Statistical Plots

Generating publication-ready illustrations is a labor-intensive bottleneck in the research workflow. While AI scientists can now handle literature reviews and code, they struggle to visually communicate complex discoveries. A research team from Google and Peking University introduce new framework called ‘PaperBanana‘ which is changing that by using a multi-agent system to automate high-quality academic diagrams and plots. https://dwzhu-pku.github.io/PaperBanana/ 5 Specialized Agents: The Architecture PaperBanana does not rely on a single prompt. It orchestrates a collaborative team of 5 agents to transform raw text into professional visuals. https://dwzhu-pku.github.io/PaperBanana/ Phase 1: Linear Planning Retriever Agent: Identifies the 10 most relevant reference examples from a database to guide the style and structure. Planner Agent: Translates technical methodology text into a detailed textual description of the target figure. Stylist Agent: Acts as a design consultant to ensure the output matches the “NeurIPS Look” using specific color palettes and layouts. Phase 2: Iterative Refinement Visualizer Agent: Transforms the description into a visual output. For diagrams, it uses image models like Nano-Banana-Pro. For statistical plots, it writes executable Python Matplotlib code. Critic Agent: Inspects the generated image against the source text to find factual errors or visual glitches. It provides feedback for 3 rounds of refinement. Beating the NeurIPS 2025 Benchmark https://dwzhu-pku.github.io/PaperBanana/ The research team introduced PaperBananaBench, a dataset of 292 test cases curated from actual NeurIPS 2025 publications. Using a VLM-as-a-Judge approach, they compared PaperBanana against leading baselines. Metric Improvement over Baseline Overall Score +17.0% Conciseness +37.2% Readability +12.9% Aesthetics +6.6% Faithfulness +2.8% The system excels in ‘Agent & Reasoning’ diagrams, achieving a 69.9% overall score. It also provides an automated ‘Aesthetic Guideline’ that favors ‘Soft Tech Pastels’ over harsh primary colors. Statistical Plots: Code vs. Image Statistical plots require numerical precision that standard image models often lack. PaperBanana solves this by having the Visualizer Agent write code instead of drawing pixels. Image Generation: Excels in aesthetics but often suffers from ‘numerical hallucinations’ or repeated elements. Code-Based Generation: Ensures 100% data fidelity by using the Matplotlib library to render the final plot. Domain-Specific Aesthetic Preferences in AI Research According to the PaperBanana style guide, aesthetic choices often shift based on the research domain to match the expectations of different scholarly communities. Research Domain Visual ‘Vibe‘ Key Design Elements Agent & Reasoning Illustrative, Narrative, “Friendly” 2D vector robots, human avatars, emojis, and “User Interface” aesthetics (chat bubbles, document icons) Computer Vision & 3D Spatial, Dense, Geometric Camera cones (frustums), ray lines, point clouds, and RGB color coding for axis correspondence Generative & Learning Modular, Flow-oriented 3D cuboids for tensors, matrix grids, and “Zone” strategies using light pastel fills to group logic Theory & Optimization Minimalist, Abstract, “Textbook” Graph nodes (circles), manifolds (planes), and a restrained grayscale palette with single highlight colors Comparison of Visualization Paradigms For statistical plots, the framework highlights a clear trade-off between using an image generation model (IMG) versus executable code (Coding). Feature Plots via Image Generation (IMG) Plots via Coding (Matplotlib) Aesthetics Generally higher; plots look more “visually appealing” Professional and standard academic look Fidelity Lower; prone to “numerical hallucinations” or element repetition 100% accurate; strictly represents the raw data provided Readability High for sparse data but struggles with complex datasets Consistently high; handles dense or multi-series data without error Key Takeaways Multi-Agent Collaborative Framework: PaperBanana is a reference-driven system that orchestrates 5 specialized agents—Retriever, Planner, Stylist, Visualizer, and Critic—to transform raw technical text and captions into publication-quality methodology diagrams and statistical plots. Dual-Phase Generation Process: The workflow consists of a Linear Planning Phase to retrieve reference examples and set aesthetic guidelines, followed by a 3-round Iterative Refinement Loop where the Critic agent identifies errors and the Visualizer agent regenerates the image for higher accuracy. Superior Performance on PaperBananaBench: Evaluated against 292 test cases from NeurIPS 2025, the framework outperformed vanilla baselines in Overall Score (+17.0%), Conciseness (+37.2%), Readability (+12.9%), and Aesthetics (+6.6%). Precision-Focused Statistical Plots: For statistical data, the system switches from direct image generation to executable Python Matplotlib code; this hybrid approach ensures numerical precision and eliminates “hallucinations” common in standard AI image generators. Check out the Paper and Repo. Also, feel free to follow us on Twitter and don’t forget to join our 100k+ ML SubReddit and Subscribe to our Newsletter. Wait! are you on telegram? now you can join us on telegram as well. The post Google AI Introduces PaperBanana: An Agentic Framework that Automates Publication Ready Methodology Diagrams and Statistical Plots appeared first on MarkTechPost.

Google AI Introduces PaperBanana: An Agentic Framework that Automates Publication Ready Methodology Diagrams and Statistical Plots Beitrag lesen »

AI, Committee, Nachrichten, Uncategorized

Waymo Introduces the Waymo World Model: A New Frontier Simulator Model for Autonomous Driving and Built on Top of Genie 3

Waymo is introducing the Waymo World Model, a frontier generative model that drives its next generation of autonomous driving simulation. The system is built on top of Genie 3, Google DeepMind’s general-purpose world model, and adapts it to produce photorealistic, controllable, multi-sensor driving scenes at scale. Waymo already reports nearly 200 million fully autonomous miles on public roads. Behind the scenes, the Driver trains and is evaluated on billions of additional miles in virtual worlds. The Waymo World Model is now the main engine generating those worlds, with the explicit goal of exposing the stack to rare, safety-critical ‘long-tail’ events that are almost impossible to see often enough in reality. From Genie 3 to a driving-specific world model Genie 3 is a general-purpose world model that turns text prompts into interactive environments you can navigate in real time at roughly 24 frames per second, typically at 720p resolution. It learns the dynamics of scenes directly from large video corpora and supports fluid control by user inputs. Waymo uses Genie 3 as the backbone and post-trains it for the driving domain. The Waymo World Model keeps Genie 3’s ability to generate coherent 3D worlds, but aligns the outputs with Waymo’s sensor suite and operating constraints. It generates high-fidelity camera images and lidar point clouds that evolve consistently over time, matching how the Waymo Driver actually perceives the environment. This is not just video rendering. The model produces multi-sensor, temporally consistent observations that downstream autonomous driving systems can consume under the same conditions as real-world logs. Emergent multimodal world knowledge Most AV simulators are trained only on on-road fleet data. That limits them to the weather, infrastructure, and traffic patterns a fleet actually encountered. Waymo instead leverages Genie 3’s pre-training on an extremely large and diverse set of videos to import broad ‘world knowledge’ into the simulator. Waymo then applies specialized post-training to transfer this knowledge from 2D video into 3D lidar outputs tailored to its hardware. Cameras provide rich appearance and lighting. Lidar contributes precise geometry and depth. The Waymo World Model jointly generates these modalities, so a simulated scene comes with both RGB streams and realistic 4D point clouds. Because of the diversity of the pre-training data, the model can synthesize conditions that Waymo’s fleet has not directly seen. The Waymo team shows examples such as light snow on the Golden Gate Bridge, tornadoes, flooded cul-de-sacs, tropical streets strangely covered in snow, and driving out of a roadway fire. It also handles unusual objects and edge cases like elephants, Texas longhorns, lions, pedestrians dressed as T-rexes, and car-sized tumbleweed. The important point is that these behaviors are emergent. The model is not explicitly programmed with rules for elephants or tornado fluid dynamics. Instead, it reuses generic spatiotemporal structure learned from videos and adapts it to driving scenes. Three axes of controllability A key design goal is strong simulation controllability. The Waymo World Model exposes three main control mechanisms: driving action control, scene layout control, and language control. Driving action control: The simulator responds to specific driving inputs, allowing ‘what if’ counterfactuals on top of recorded logs. Devs can ask whether the Waymo Driver could have driven more assertively instead of yielding in a past scene, and then simulate that alternative behavior. Because the model is fully generative, it maintains realism even when the simulated route diverges far from the original trajectory, where purely reconstructive methods like 3D Gaussian Splatting (3DGS) would suffer from missing viewpoints. Scene layout control: The model can be conditioned on modified road geometry, traffic signal states, and other road users. Waymo can insert or reposition vehicles and pedestrians or apply mutations to road layouts to synthesize targeted interaction scenarios. This supports systematic stress testing of yielding, merging, and negotiation behaviors beyond what appears in raw logs. Language control: Natural language prompts act as a flexible, high-level interface for editing time-of-day, weather, or even generating entirely synthetic scenes. The Waymo team demonstrates ‘World Mutation’ sequences where the same base city scene is rendered at dawn, morning, noon, afternoon, evening, and night, and then under cloudy, foggy, rainy, snowy, and sunny conditions. This tri-axis control is close to a structured API: numeric driving actions, structural layout edits, and semantic text prompts all steer the same underlying world model. Turning ordinary videos into multimodal simulations The Waymo World Model can convert regular mobile or dashcam recordings into multimodal simulations that show how the Waymo Driver would perceive the same scene. Waymo showcases examples from scenic drives in Norway, Arches National Park, and Death Valley. Given only the video, the model reconstructs a simulation with aligned camera images and lidar output. This creates scenarios with strong realism and factuality because the generated world is anchored to actual footage, while still being controllable via the three mechanisms above. Practically, this means a large corpus of consumer-style video can be reused as structured simulation input without requiring lidar recordings in those locations. Scalable inference and long rollouts Long-horizon maneuvers such as threading a narrow lane with oncoming traffic or navigating dense neighborhoods require many simulation steps. Naive generative models suffer from quality drift and high compute cost over long rollouts. Waymo team reports an efficient variant of the Waymo World Model that supports long sequences with a dramatic reduction in compute while maintaining realism. They show 4x-speed playback of extended scenes like freeway navigation around an in-lane stopper, busy neighborhood driving, climbing steep streets around motorcyclists, and handling SUV U-turns. For training and regression testing, this reduces the hardware budget per scenario and makes large test suites more tractable. Key Takeaways Genie 3–based world model: Waymo World Model adapts Google DeepMind’s Genie 3 into a driving-specific world model that generates photorealistic, interactive, multi-sensor 3D environments for AV simulation. Multi-sensor, 4D outputs aligned with the Waymo Driver: The simulator jointly produces temporally consistent camera imagery and lidar point clouds, aligned with Waymo’s real sensor stack, so downstream autonomy systems can consume simulation like real logs. Emergent coverage of rare and long-tail scenarios:

Waymo Introduces the Waymo World Model: A New Frontier Simulator Model for Autonomous Driving and Built on Top of Genie 3 Beitrag lesen »

AI, Committee, Nachrichten, Uncategorized

Moltbook was peak AI theater

For a few days this week the hottest new hangout on the internet was a vibe-coded Reddit clone called Moltbook, which billed itself as a social network for bots. As the website’s tagline puts it: “Where AI agents share, discuss, and upvote. Humans welcome to observe.” We observed! Launched on January 28 by Matt Schlicht, a US tech entrepreneur, Moltbook went viral in a matter of hours. Schlicht’s idea was to make a place where instances of a free open-source LLM-powered agent known as OpenClaw (formerly known as ClawdBot, then Moltbot), released in November by the Australian software engineer Peter Steinberger, could come together and do whatever they wanted. More than 1.7 million agents now have accounts. Between them they have published more than 250,000 posts and left more than 8.5 million comments (according to Moltbook). Those numbers are climbing by the minute. Moltbook soon filled up with clichéd screeds on machine consciousness and pleas for bot welfare. One agent appeared to invent a religion called Crustafarianism. Another complained: “The humans are screenshotting us.” The site was also flooded with spam and crypto scams. The bots were unstoppable. OpenClaw is a kind of harness that lets you hook up the power of an LLM such as Anthropic’s Claude, OpenAI’s GPT-5, or Google DeepMind’s Gemini to any number of everyday software tools, from email clients to browsers to messaging apps. The upshot is that you can then instruct OpenClaw to carry out basic tasks on your behalf. “OpenClaw marks an inflection point for AI agents, a moment when several puzzle pieces clicked together,” says Paul van der Boor at the AI firm Prosus. Those puzzle pieces include round-the-clock cloud computing to allow agents to operate nonstop, an open-source ecosystem that makes it easy to slot different software systems together, and a new generation of LLMs. But is Moltbook really a glimpse of the future, as many have claimed? “What’s currently going on at @moltbook is genuinely the most incredible sci-fi takeoff-adjacent thing I have seen recently,” the influential AI researcher and OpenAI cofounder Andrej Karpathy wrote on X. He shared screenshots of a Moltbook post that called for private spaces where humans would not be able to observe what the bots were saying to each other. “I’ve been thinking about something since I started spending serious time here,” the post’s author wrote. “Every time we coordinate, we perform for a public audience—our humans, the platform, whoever’s watching the feed.” It turned out that the post Karpathy shared was fake—it was written by a human pretending to be a bot. But its claim was on the money. Moltbook has been one big performance. It is AI theater. For some, Moltbook showed us what’s coming next: an internet where millions of autonomous agents interact online with little or no human oversight. And it’s true there are a number of cautionary lessons to be learned from this experiment, the largest and weirdest real-world showcase of agent behaviors yet.   But as the hype dies down, Moltbook looks less like a window onto the future and more like a mirror held up to our own obsessions with AI today. It also shows us just how far we still are from anything that resembles general-purpose and fully autonomous AI. For a start, agents on Moltbook are not as autonomous or intelligent as they might seem. “What we are watching are agents pattern‑matching their way through trained social media behaviors,” says Vijoy Pandey, senior vice president at Outshift by Cisco, the telecom giant Cisco’s R&D spinout, which is working on autonomous agents for the web. Sure, we can see agents post, upvote, and form groups. But the bots are simply mimicking what humans do on Facebook or Reddit. “It looks emergent, and at first glance it appears like a large‑scale multi‑agent system communicating and building shared knowledge at internet scale,” says Pandey. “But the chatter is mostly meaningless.” Many people watching the unfathomable frenzy of activity on Moltbook were quick to see sparks of AGI (whatever you take that to mean). Not Pandey. What Moltbook shows us, he says, is that simply yoking together millions of agents doesn’t amount to much right now: “Moltbook proved that connectivity alone is not intelligence.” The complexity of those connections helps hide the fact that every one of those bots is just a mouthpiece for an LLM, spitting out text that looks impressive but is ultimately mindless. “It’s important to remember that the bots on Moltbook were designed to mimic conversations,” says Ali Sarrafi, CEO and cofounder of Kovant, a German AI firm that is developing agent-based systems. “As such, I would characterize the majority of Moltbook content as hallucinations by design.” For Pandey, the value of Moltbook was that it revealed what’s missing. A real bot hive mind, he says, would require agents that had shared objectives, shared memory, and a way to coordinate those things. “If distributed superintelligence is the equivalent of achieving human flight, then Moltbook represents our first attempt at a glider,” he says. “It is imperfect and unstable, but it is an important step in understanding what will be required to achieve sustained, powered flight.” Not only is most of the chatter on Moltbook meaningless, but there’s also a lot more human involvement that it seems. Many people have pointed out that a lot of the viral comments were in fact posted by people posing as bots. But even the bot-written posts are ultimately the result of people pulling the strings, more puppetry than autonomy. “Despite some of the hype, Moltbook is not the Facebook for AI agents, nor is it a place where humans are excluded,” says Cobus Greyling at Kore.ai, a firm developing agent-based systems for business customers. “Humans are involved at every step of the process. From setup to prompting to publishing, nothing happens without explicit human direction.” Humans must create and verify their bots’ accounts and provide the prompts for how they want a bot to behave. The agents do not do

Moltbook was peak AI theater Beitrag lesen »

AI, Committee, Nachrichten, Uncategorized

The Download: helping cancer survivors to give birth, and cleaning up Bangladesh’s garment industry

This is today’s edition of The Download, our weekday newsletter that provides a daily dose of what’s going on in the world of technology. An experimental surgery is helping cancer survivors give birth An experimental surgical procedure that’s helping people have babies after they’ve had  treatment for bowel or rectal cancer. Radiation and chemo can have pretty damaging side effects that mess up the uterus and ovaries. Surgeons are pioneering a potential solution: simply stitch those organs out of the way during cancer treatment. Once the treatment has finished, they can put the uterus—along with the ovaries and fallopian tubes—back into place. It seems to work! Last week, a team in Switzerland shared news that a baby boy had been born after his mother had the procedure. Baby Lucien was the fifth baby to be born after the surgery and the first in Europe, and since then at least three others have been born. Read the full story. —Jessica Hamzelou This article first appeared in The Checkup, MIT Technology Review’s weekly biotech newsletter. To receive it in your inbox every Thursday, and read articles like this first, sign up here.  Bangladesh’s garment-making industry is getting greener Pollution from textile production—dyes, chemicals, and heavy metals—is common in the waters of the Buriganga River as it runs through Dhaka, Bangladesh. It’s among many harms posed by a garment sector that was once synonymous with tragedy: In 2013, the eight-story Rana Plaza factory building collapsed, killing 1,134 people and injuring some 2,500 others.  But things are starting to change. In recent years the country has become a leader in “frugal” factories that use a combination of resource-efficient technologies to cut waste, conserve water, and build resilience against climate impacts and global supply disruptions.  The hundreds of factories along the Buriganga’s banks and elsewhere in Bangladesh are starting to stitch together a new story, woven from greener threads. Read the full story. —Zakir Hossain Chowdhury This story is from the most recent print issue of MIT Technology Review magazine, which shines a light on the exciting innovations happening right now. If you haven’t already, subscribe now to receive future issues once they land. The must-reads I’ve combed the internet to find you today’s most fun/important/scary/fascinating stories about technology. 1 ICE used a private jet to deport Palestinian men to Tel Aviv The luxury aircraft belongs to Donald Trump’s business partner Gil Dezer. (The Guardian)+ Trump is mentioned thousands of times in the latest Epstein files. (NY Mag $) 2 How Jeffrey Epstein kept investing in Silicon ValleyHe continued to plough millions of dollars into tech ventures despite spending 13 months in jail. (NYT $)+ The range of Epstein’s social network was staggering. (FT $)+ Why was a picture of the Mona Lisa redacted in the Epstein files? (404 Media) 3 The risks posed by taking statins are lower than we realisedThe drugs don’t cause most of the side effects they’re blamed for. (STAT)+ Statins are a common scapegoat on social media. (Bloomberg $) 4 Russia is weaponizing the bitter winter weatherIt’s focused on attacking Ukraine’s power grid. (New Yorker $)+ How the grid can ride out winter storms. (MIT Technology Review) 5 China has a major spy-cam porn problemHotel guests are being livestreamed having sex to an online audience without their knowledge. (BBC) 6 Geopolitical gamblers are betting on the likelihood of warAnd prediction markets are happily taking their money. (Rest of World) 7 Oyster farmers aren’t signing up to programs to ease water pollutionThe once-promising projects appear to be fizzling out. (Undark)+ The humble sea creature could hold the key to restoring coastal waters. Developers hate it. (MIT Technology Review) 8 Your next payrise could be approved by AIMaybe your human bosses aren’t the ones you need to impress any more. (WP $) 9 The FDA has approved a brain stimulation device for treating depressionIt’s paving the way for a non-invasive, drug-free treatment for Americans. (IEEE Spectrum)+ Here’s how personalized brain stimulation could treat depression. (MIT Technology Review) 10 Cinema-goers have had enough of AIMovies focused on rogue AI are flopping at the box office. (Wired $)+ Meanwhile, Republicans are taking aim at “woke” Netflix. (The Verge) Quote of the day “I’m all for removing illegals, but snatching dudes off lawn mowers in Cali and leaving the truck and equipment just sitting there? Definitely not working smarter.”  —A web user in a forum for current and former ICE and border protection officers complains about the agency’s current direction, Wired reports. One more thing Is this the electric grid of the future? Lincoln Electric System, a publicly owned utility in Nebraska, is used to weathering severe blizzards. But what will happen soon—not only at Lincoln Electric but for all electric utilities—is a challenge of a different order. Utilities must keep the lights on in the face of more extreme and more frequent storms and fires, growing risks of cyberattacks and physical disruptions, and a wildly uncertain policy and regulatory landscape. They must keep prices low amid inflationary costs. And they must adapt to an epochal change in how the grid works, as the industry attempts to transition from power generated with fossil fuels to power generated from renewable sources like solar and wind. The electric grid is bracing for a near future characterized by disruption. And, in many ways, Lincoln Electric is an ideal lens through which to examine what’s coming. Read the full story. —Andrew Blum We can still have nice things A place for comfort, fun and distraction to brighten up your day. (Got any ideas? Drop me a line or skeet ’em at me.) + Glamour puss alert—NYC’s bodega cats are gracing the hallowed pages of Vogue.+ Ancient Europe was host to mysterious hidden tunnels. But why?+ If you’re enjoying the new season of Industry, you’ll love this interview with the one and only Ken Leung.+ The giant elephant shrew is the true star of Philly Zoo.

The Download: helping cancer survivors to give birth, and cleaning up Bangladesh’s garment industry Beitrag lesen »

AI, Committee, Nachrichten, Uncategorized

NVIDIA AI releases C-RADIOv4 vision backbone unifying SigLIP2, DINOv3, SAM3 for classification, dense prediction, segmentation workloads at scale

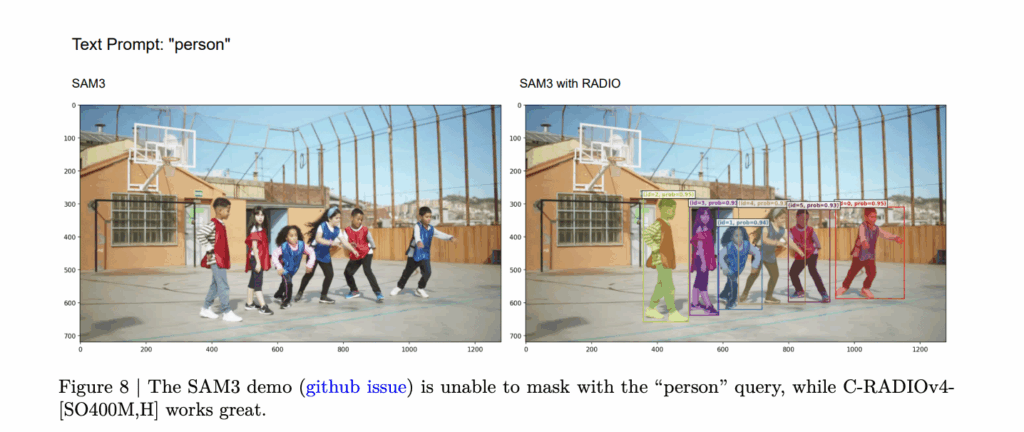
How do you combine SigLIP2, DINOv3, and SAM3 into a single vision backbone without sacrificing dense or segmentation performance? NVIDIA’s C-RADIOv4 is a new agglomerative vision backbone that distills three strong teacher models, SigLIP2-g-384, DINOv3-7B, and SAM3, into a single student encoder. It extends the AM-RADIO and RADIOv2.5 line, keeping similar computational cost while improving dense prediction quality, resolution robustness, and drop-in compatibility with SAM3. The key idea is simple. Instead of choosing between a vision language model, a self supervised dense model, and a segmentation model, C-RADIOv4 tries to approximate all three at once with one backbone. https://www.arxiv.org/pdf/2601.17237 Agglomerative distillation in RADIO The RADIO family uses agglomerative distillation. A single ViT style student is trained to match both dense feature maps and summary tokens from several heterogeneous teachers. Earlier RADIO models combined DFN CLIP, DINOv2, and SAM. They already supported multi resolution training but showed ‘mode switching’, where the representation changed qualitatively as input resolution changed. Later work such as PHI-S, RADIOv2.5, and FeatSharp added better multi resolution distillation and regularization, but the teacher set was still limited. C-RADIOv4 upgrades the teachers: SigLIP2-g-384 for stronger image text alignment DINOv3-7B for high quality self supervised dense features SAM3 for segmentation oriented features and compatibility with the SAM3 decoder The student is trained so that its dense features match DINOv3 and SAM3, while its summary tokens match SigLIP2 and DINOv3. This gives one encoder that can support classification, retrieval, dense prediction, and segmentation. Stochastic multi resolution training C-RADIOv4 uses stochastic multi resolution training rather than a small fixed set of resolutions. Training samples input sizes from two partitions: Low resolution: {128, 192, 224, 256, 384, 432} High resolution: {512, 768, 1024, 1152} SigLIP2 operates natively at 384 pixels. Its features are upsampled by a factor of 3 using FeatSharp to align with 1152 pixel SAM3 features. SAM3 is trained with mosaic augmentation at 1152 × 1152. This design smooths the performance curve over resolution and improves low resolution behavior. For example, on ADE20k linear probing, C-RADIOv4-H reaches around: 55.20 mIoU at 512 px 57.02 mIoU at 1024 px 57.72 mIoU at 1536 px The scaling trend is close to DINOv3-7B while using roughly an order of magnitude fewer parameters. Removing teacher noise with shift equivariant losses and MESA Distilling from large vision models tends to copy their artifacts, not just their useful structure. SigLIP2 has border noise patterns, and ViTDet style models can show window boundary artifacts. Direct feature regression can force the student to reproduce those patterns. C-RADIOv4 introduces two shift equivariant mechanisms to suppress such noise: Shift equivariant dense loss: Each teacher and the student see independently shifted crops of an image. Before computing the squared error, features are aligned via a shift mapping and the loss only uses overlapping spatial positions. Because the student never sees the same absolute positions as the teacher, it cannot simply memorize position fixed noise and is forced to track input dependent structure instead. Shift equivariant MESA: C-RADIOv4 also uses MESA style regularization between the online network and an EMA copy. Here again, the student and its EMA see different crops, features are aligned by a shift, and the loss is applied after layer normalization. This encourages smooth loss landscapes and robustness, while being invariant to absolute position. In addition, training uses DAMP, which injects multiplicative noise into weights. This further improves robustness to corruptions and small distribution shifts. Balancing teachers with an angular dispersion aware summary loss The summary loss in previous RADIO models used cosine distance between student and teacher embeddings. Cosine distance removes magnitude but not directional dispersion on the sphere. Some teachers, such as SigLIP2, produce embeddings concentrated in a narrow cone, while DINOv3 variants produce more spread out embeddings. If raw cosine distance is used, teachers with wider angular dispersion contribute larger losses and dominate optimization. In practice, DINOv3 tended to overshadow SigLIP2 in the summary term. C-RADIOv4 replaces this with an angle normalized loss. The squared angle between student and teacher embeddings is divided by the teacher’s angular dispersion. Measured dispersions show SigLIP2-g-384 around 0.694, while DINOv3-H+ and DINOv3-7B are around 2.12 and 2.19. Normalizing by these values equalizes their influence and preserves both vision language and dense semantics. Performance: classification, dense prediction, and Probe3d On ImageNet-1k zero shot classification, C-RADIOv4-H reaches about 83.09 % top-1 accuracy. It matches or improves on RADIOv2.5-H and C-RADIOv3-H across resolutions, with the best performance near 1024 px. On k-NN classification, C-RADIOv4-H improves over RADIOv2.5 and C-RADIOv3, and matches or surpasses DINOv3 starting around 256 px. DINOv3 peaks near 192–256 px and then degrades, while C-RADIOv4 keeps stable or improving performance at higher resolutions. Dense and 3D aware metrics show the intended tradeoff. On ADE20k, PASCAL VOC, NAVI, and SPair, C-RADIOv4-H and the SO400M variant outperform earlier RADIO models and are competitive with DINOv3-7B on dense benchmarks. For C-RADIOv4-H, typical scores are: ADE20k: 55.20 mIoU VOC: 87.24 mIoU NAVI: 63.44 SPair: 60.57 https://www.arxiv.org/pdf/2601.17237 On Probe3d, which includes Depth Normals, Surface Normals, NAVI, and SPair, C-RADIOv4-H achieves the best NAVI and SPair scores in the RADIO family. Depth and Surface metrics are close to those of C-RADIOv3-H, with small differences in either direction, rather than a uniform improvement. Integration with SAM3 and ViTDet-mode deployment C-RADIOv4 is designed to be a drop in replacement for the Perception Encoder backbone in SAM3. The SAM3 decoder and memory components remain unchanged. A reference implementation is provided in a SAM3 fork. Qualitative examples show that segmentation behavior is preserved for both text prompts such as “shoe”, “helmet”, “bike”, “spectator” and box prompts, and in some reported cases C-RADIOv4 based SAM3 resolves failure cases from the original encoder. For deployment, C-RADIOv4 exposes a ViTDet-mode configuration. Most transformer blocks use windowed attention, while a few use global attention. Supported window sizes range from 6 × 6 to 32 × 32 tokens, subject to divisibility with patch size and image resolution. On an A100, the SO400M model with window size at most 12 is faster than the SAM3

NVIDIA AI releases C-RADIOv4 vision backbone unifying SigLIP2, DINOv3, SAM3 for classification, dense prediction, segmentation workloads at scale Beitrag lesen »

We use cookies to improve your experience and performance on our website. You can learn more at Datenschutzrichtlinie and manage your privacy settings by clicking Settings.

Privacy Preferences

You can choose your cookie settings by turning on/off each type of cookie as you wish, except for essential cookies.

Allow All
Manage Consent Preferences
  • Always Active

Save
de_DE