YouZum

Committee

AI, Committee, Notizie, Uncategorized

Uncertainty Quantification for Language Models: A Suite of Black-Box, White-Box, LLM Judge, and Ensemble Scorers

arXiv:2504.19254v4 Announce Type: replace Abstract: Hallucinations are a persistent problem with Large Language Models (LLMs). As these models become increasingly used in high-stakes domains, such as healthcare and finance, the need for effective hallucination detection is crucial. To this end, we outline a versatile framework for closed-book hallucination detection that practitioners can apply to real-world use cases. To achieve this, we adapt a variety of existing uncertainty quantification (UQ) techniques, including black-box UQ, white-box UQ, and LLM-as-a-Judge, transforming them as necessary into standardized response-level confidence scores ranging from 0 to 1. To enhance flexibility, we propose a tunable ensemble approach that incorporates any combination of the individual confidence scores. This approach enables practitioners to optimize the ensemble for a specific use case for improved performance. To streamline implementation, the full suite of scorers is offered in this paper’s companion Python toolkit, UQLM. To evaluate the performance of the various scorers, we conduct an extensive set of experiments using several LLM question-answering benchmarks. We find that our tunable ensemble typically surpasses its individual components and outperforms existing hallucination detection methods. Our results demonstrate the benefits of customized hallucination detection strategies for improving the accuracy and reliability of LLMs.

Uncertainty Quantification for Language Models: A Suite of Black-Box, White-Box, LLM Judge, and Ensemble Scorers Leggi l'articolo »

AI, Committee, Notizie, Uncategorized

The Learning Dynamics of Subword Segmentation for Morphologically Diverse Languages

arXiv:2511.09197v1 Announce Type: new Abstract: Subword segmentation is typically applied in preprocessing and stays fixed during training. Alternatively, it can be learned during training to optimise the training objective. In this paper we study the learning dynamics of subword segmentation: if a language model can dynamically optimise tokenisation, how do its subwords evolve during pretraining and finetuning? To explore this, we extend the subword segmental language model (SSLM), a framework for learning subwords during training, to support pretraining and finetuning. We train models for three typologically diverse languages to study learning dynamics across the morphological spectrum: Isi-Xhosa is conjunctive (long word forms composed of many morphemes), Setswana is disjunctive (morphemes written as separate words), and English represents a typological middle ground. We analyse subword dynamics from a linguistic perspective, tracking morphology, productivity, and fertility. We identify four stages of subword learning, with the morphologically complex isi-Xhosa exhibiting greater instability. During finetuning, subword boundaries shift to become finer-grained. Lastly, we show that learnable subwords offers a promising approach to improve text generation and cross-lingual transfer for low-resource, morphologically complex languages.

The Learning Dynamics of Subword Segmentation for Morphologically Diverse Languages Leggi l'articolo »

AI, Committee, Notizie, Uncategorized

Estranged Predictions: Measuring Semantic Category Disruption with Masked Language Modelling

arXiv:2511.08109v1 Announce Type: new Abstract: This paper examines how science fiction destabilises ontological categories by measuring conceptual permeability across the terms human, animal, and machine using masked language modelling (MLM). Drawing on corpora of science fiction (Gollancz SF Masterworks) and general fiction (NovelTM), we operationalise Darko Suvin’s theory of estrangement as computationally measurable deviation in token prediction, using RoBERTa to generate lexical substitutes for masked referents and classifying them via Gemini. We quantify conceptual slippage through three metrics: retention rate, replacement rate, and entropy, mapping the stability or disruption of category boundaries across genres. Our findings reveal that science fiction exhibits heightened conceptual permeability, particularly around machine referents, which show significant cross-category substitution and dispersion. Human terms, by contrast, maintain semantic coherence and often anchor substitutional hierarchies. These patterns suggest a genre-specific restructuring within anthropocentric logics. We argue that estrangement in science fiction operates as a controlled perturbation of semantic norms, detectable through probabilistic modelling, and that MLMs, when used critically, serve as interpretive instruments capable of surfacing genre-conditioned ontological assumptions. This study contributes to the methodological repertoire of computational literary studies and offers new insights into the linguistic infrastructure of science fiction.

Estranged Predictions: Measuring Semantic Category Disruption with Masked Language Modelling Leggi l'articolo »

AI, Committee, Notizie, Uncategorized

OpenVLThinker: Complex Vision-Language Reasoning via Iterative SFT-RL Cycles

arXiv:2503.17352v3 Announce Type: replace-cross Abstract: We introduce OpenVLThinker, one of the first open-source large vision-language models (LVLMs) to exhibit sophisticated chain-of-thought reasoning, achieving notable performance gains on challenging visual reasoning tasks. While text-based reasoning models (e.g., Deepseek R1) show promising results in text-only tasks, distilling their reasoning into LVLMs via supervised fine-tuning (SFT) often results in performance degradation due to imprecise visual grounding. Conversely, purely reinforcement learning (RL)-based methods face a large search space, hindering the emergence of reflective behaviors in smaller models (e.g., 7B LVLMs). Surprisingly, alternating between SFT and RL ultimately results in significant performance improvements after a few iterations. Our analysis reveals that the base model rarely exhibits reasoning behaviors initially, but SFT effectively surfaces these latent actions and narrows the RL search space, accelerating the development of reasoning capabilities. Each subsequent RL stage further refines the model’s reasoning skills, producing higher-quality SFT data for continued self-improvement. OpenVLThinker-7B consistently advances performance across six benchmarks demanding mathematical and general reasoning, notably improving MathVista by 3.8%, EMMA by 2.4%, and HallusionBench by 1.6%. Beyond demonstrating the synergy between SFT and RL for complex reasoning tasks, our findings provide early evidence towards achieving R1-style reasoning in multimodal contexts. The code, model and data are held at https://github.com/yihedeng9/OpenVLThinker.

OpenVLThinker: Complex Vision-Language Reasoning via Iterative SFT-RL Cycles Leggi l'articolo »

AI, Committee, Notizie, Uncategorized

Multimodal LLMs Do Not Compose Skills Optimally Across Modalities

arXiv:2511.08113v1 Announce Type: new Abstract: Skill composition is the ability to combine previously learned skills to solve new tasks. As neural networks acquire increasingly complex skills during their pretraining, it is not clear how successfully they can compose them. In this paper, we focus on Multimodal Large Language Models (MLLM), and study their ability to compose skills across modalities. To this end, we design three evaluation tasks which can be solved sequentially composing two modality-dependent skills, and evaluate several open MLLMs under two main settings: i) prompting the model to directly solve the task, and ii) using a two-step cascaded inference approach, which manually enforces the composition of the two skills for a given task. Even with these straightforward compositions, we find that all evaluated MLLMs exhibit a significant cross-modality skill composition gap. To mitigate the aforementioned gap, we explore two alternatives: i) use chain-of-thought prompting to explicitly instruct MLLMs for skill composition and ii) a specific fine-tuning recipe to promote skill composition. Although those strategies improve model performance, they still exhibit significant skill composition gaps, suggesting that more research is needed to improve cross-modal skill composition in MLLMs.

Multimodal LLMs Do Not Compose Skills Optimally Across Modalities Leggi l'articolo »

AI, Committee, Notizie, Uncategorized

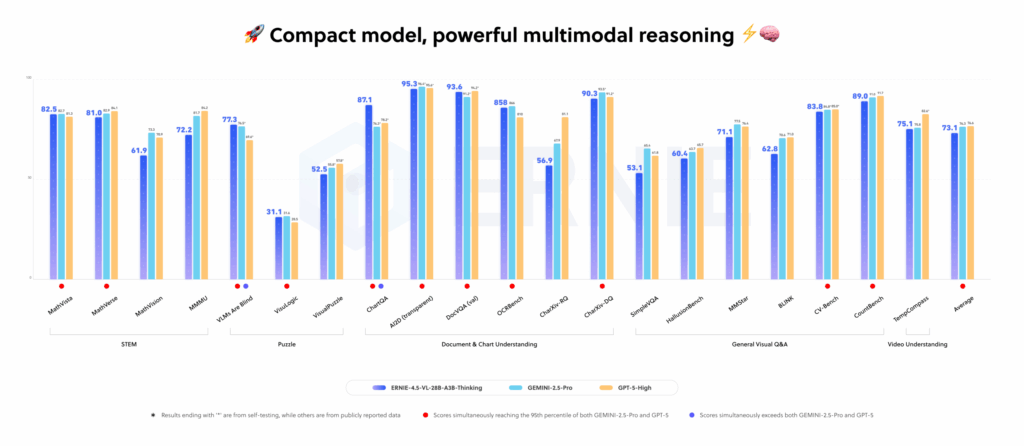
Baidu Releases ERNIE-4.5-VL-28B-A3B-Thinking: An Open-Source and Compact Multimodal Reasoning Model Under the ERNIE-4.5 Family

How can we get large model level multimodal reasoning for documents, charts and videos while running only a 3B class model in production? Baidu has added a new model to the ERNIE-4.5 open source family. ERNIE-4.5-VL-28B-A3B-Thinking is a vision language model that focuses on document, chart and video understanding with a small active parameter budget. https://huggingface.co/baidu/ERNIE-4.5-VL-28B-A3B-Thinking Architecture and training setup ERNIE-4.5-VL-28B-A3B-Thinking is built on the ERNIE-4.5-VL-28B-A3B Mixture of Experts architecture. The family uses a heterogeneous multimodal MoE design with shared parameters across text and vision plus modality specific experts. At the model level, it has 30B total parameters, while the architecture is in the 28B-VL branch, and only 3B parameters are activated per token through an A3B routing scheme. This gives the compute and memory profile of a 3B class model while keeping a larger capacity pool for reasoning. The model goes through an additional mid training stage on a large visual language reasoning corpus. This stage is designed to improve representation power and semantic alignment between visual and language modalities, which matters for dense text in documents and fine structures in charts. On top of that, ERNIE-4.5-VL-28B-A3B-Thinking uses multimodal reinforcement learning on verifiable tasks, with GSPO and IcePop strategies and dynamic difficulty sampling to stabilize MoE training and push the model toward hard examples. Key capabilities Baidu researchers position this model as a lightweight multimodal reasoning engine that can activate only 3B parameters while approaching the behavior of larger flagship systems on internal benchmarks. Officially listed capabilities include visual reasoning, STEM reasoning, visual grounding, Thinking with Images, tool utilization and video understanding. Thinking with Images is at the core. The model can zoom into regions, reason on cropped views and then integrate those local observations into a final answer. Tool utilization extends this with calls to tools such as image search when internal knowledge is not enough. Both features are exposed as part of the reasoning parser and tool call parser path in deployment. Performance and positioning The lightweight vision language model ERNIE-4.5-VL-28B-A3B achieves competitive or superior performance compared to Qwen-2.5-VL-7B and Qwen-2.5-VL-32B on many benchmarks, while using fewer activation parameters. ERNIE-4.5-VL models also support both thinking and non thinking modes, with the thinking mode improving reasoning centered tasks while keeping strong perception quality. For the specific Thinking variant, Baidu researchers describe ERNIE-4.5-VL-28B-A3B-Thinking as closely matching the performance of industry flagship models across internal multimodal benchmarks. Key Takeaways ERNIE-4.5-VL-28B-A3B-Thinking uses a Mixture of Experts architecture with about 30B total parameters and only 3B active parameters per token to deliver efficient multimodal reasoning. The model is optimized for document, chart and video understanding through an additional visual language reasoning mid training stage and multimodal reinforcement learning using GSPO, IcePop and dynamic difficulty sampling. Thinking with Images lets the model iteratively zoom into image regions and reason over crops, while tool utilization enables calls to external tools such as image search for long tail recognition. It demonstrate strong performance on analytics style charts, STEM circuit problems, visual grounding with JSON bounding boxes and video segment localization with timestamped answers. The model is released under Apache License 2.0, supports deployment via transformers, vLLM and FastDeploy, and can be fine tuned with ERNIEKit using SFT, LoRA and DPO for commercial multimodal applications. Comparison Table Model Training stage Total / active parameters Modalities Context length (tokens) ERNIE-4.5-VL-28B-A3B-Base Pretraining 28B total, 3B active per token Text, Vision 131,072 ERNIE-4.5-VL-28B-A3B (PT) Posttraining chat model 28B total, 3B active per token Text, Vision 131,072 ERNIE-4.5-VL-28B-A3B-Thinking Reasoning oriented mid training on ERNIE-4.5-VL-28B-A3B 28B architecture, 3B active per token, HF model size 30B params Text, Vision 131,072 (FastDeploy example uses 131,072 max model length) Qwen2.5-VL-7B-Instruct Posttraining vision language model ≈8B total (7B class) Text, Image, Video 32,768 text positions in config (max_position_embeddings) Qwen2.5-VL-32B-Instruct Posttraining plus reinforcement tuned large VL model 33B total Text, Image, Video 32,768 text positions (same Qwen2.5-VLTextConfig family) Editorial Comments ERNIE-4.5-VL-28B-A3B-Thinking is a practical release for teams that want multimodal reasoning on documents, charts and videos with only 3B activated parameters, while still using a Mixture-of-Experts architecture with about 30B total parameters and Apache License 2.0. It connects Thinking with Images, tool utilization and multimodal reinforcement learning into a deployable stack that directly targets real world analytics and understanding workloads. Check out the Repo, Model Weights and Technical details. Feel free to check out our GitHub Page for Tutorials, Codes and Notebooks. Also, feel free to follow us on Twitter and don’t forget to join our 100k+ ML SubReddit and Subscribe to our Newsletter. Wait! are you on telegram? now you can join us on telegram as well. The post Baidu Releases ERNIE-4.5-VL-28B-A3B-Thinking: An Open-Source and Compact Multimodal Reasoning Model Under the ERNIE-4.5 Family appeared first on MarkTechPost.

Baidu Releases ERNIE-4.5-VL-28B-A3B-Thinking: An Open-Source and Compact Multimodal Reasoning Model Under the ERNIE-4.5 Family Leggi l'articolo »

AI, Committee, Notizie, Uncategorized

How to Build an End-to-End Interactive Analytics Dashboard Using PyGWalker Features for Insightful Data Exploration

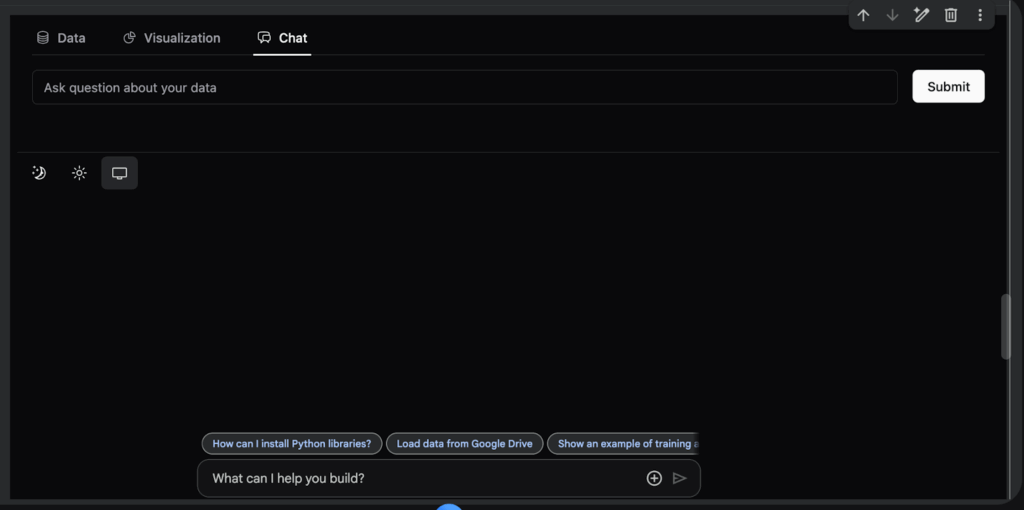
In this tutorial, we explore the advanced capabilities of PyGWalker, a powerful tool for visual data analysis that integrates seamlessly with pandas. We begin by generating a realistic e-commerce dataset enriched with time, demographic, and marketing features to mimic real-world business data. We then prepare multiple analytical views, including daily sales, category performance, and customer segment summaries. Finally, we use PyGWalker to interactively explore patterns, correlations, and trends across these dimensions through intuitive drag-and-drop visualizations. Check out the FULL CODES here. Copy CodeCopiedUse a different Browser !pip install pygwalker pandas numpy scikit-learn import pandas as pd import numpy as np import pygwalker as pyg from datetime import datetime, timedelta We begin by setting up our environment, installing all necessary dependencies, and importing essential libraries, including pandas, numpy, and pygwalker. We ensure that everything is ready for building our interactive data exploration workflow in Colab. Check out the FULL CODES here. Copy CodeCopiedUse a different Browser def generate_advanced_dataset(): np.random.seed(42) start_date = datetime(2022, 1, 1) dates = [start_date + timedelta(days=x) for x in range(730)] categories = [‘Electronics’, ‘Clothing’, ‘Home & Garden’, ‘Sports’, ‘Books’] products = { ‘Electronics’: [‘Laptop’, ‘Smartphone’, ‘Headphones’, ‘Tablet’, ‘Smartwatch’], ‘Clothing’: [‘T-Shirt’, ‘Jeans’, ‘Dress’, ‘Jacket’, ‘Sneakers’], ‘Home & Garden’: [‘Furniture’, ‘Lamp’, ‘Rug’, ‘Plant’, ‘Cookware’], ‘Sports’: [‘Yoga Mat’, ‘Dumbbell’, ‘Running Shoes’, ‘Bicycle’, ‘Tennis Racket’], ‘Books’: [‘Fiction’, ‘Non-Fiction’, ‘Biography’, ‘Science’, ‘History’] } n_transactions = 5000 data = [] for _ in range(n_transactions): date = np.random.choice(dates) category = np.random.choice(categories) product = np.random.choice(products[category]) base_prices = { ‘Electronics’: (200, 1500), ‘Clothing’: (20, 150), ‘Home & Garden’: (30, 500), ‘Sports’: (25, 300), ‘Books’: (10, 50) } price = np.random.uniform(*base_prices[category]) quantity = np.random.choice([1, 1, 1, 2, 2, 3], p=[0.5, 0.2, 0.15, 0.1, 0.03, 0.02]) customer_segment = np.random.choice([‘Premium’, ‘Standard’, ‘Budget’], p=[0.2, 0.5, 0.3]) age_group = np.random.choice([’18-25′, ’26-35′, ’36-45′, ’46-55′, ’56+’]) region = np.random.choice([‘North’, ‘South’, ‘East’, ‘West’, ‘Central’]) month = date.month seasonal_factor = 1.0 if month in [11, 12]: seasonal_factor = 1.5 elif month in [6, 7]: seasonal_factor = 1.2 revenue = price * quantity * seasonal_factor discount = np.random.choice([0, 5, 10, 15, 20, 25], p=[0.4, 0.2, 0.15, 0.15, 0.07, 0.03]) marketing_channel = np.random.choice([‘Organic’, ‘Social Media’, ‘Email’, ‘Paid Ads’]) base_satisfaction = 4.0 if customer_segment == ‘Premium’: base_satisfaction += 0.5 if discount > 15: base_satisfaction += 0.3 satisfaction = np.clip(base_satisfaction + np.random.normal(0, 0.5), 1, 5) data.append({ ‘Date’: date, ‘Category’: category, ‘Product’: product, ‘Price’: round(price, 2), ‘Quantity’: quantity, ‘Revenue’: round(revenue, 2), ‘Customer_Segment’: customer_segment, ‘Age_Group’: age_group, ‘Region’: region, ‘Discount_%’: discount, ‘Marketing_Channel’: marketing_channel, ‘Customer_Satisfaction’: round(satisfaction, 2), ‘Month’: date.strftime(‘%B’), ‘Year’: date.year, ‘Quarter’: f’Q{(date.month-1)//3 + 1}’ }) df = pd.DataFrame(data) df[‘Profit_Margin’] = round(df[‘Revenue’] * (1 – df[‘Discount_%’]/100) * 0.3, 2) df[‘Days_Since_Start’] = (df[‘Date’] – df[‘Date’].min()).dt.days return df We design a function to generate a comprehensive e-commerce dataset that mirrors real-world business conditions. We include product categories, customer demographics, seasonal effects, and satisfaction levels, ensuring that our data is diverse and analytically rich. Check out the FULL CODES here. Copy CodeCopiedUse a different Browser print(“Generating advanced e-commerce dataset…”) df = generate_advanced_dataset() print(f”nDataset Overview:”) print(f”Total Transactions: {len(df)}”) print(f”Date Range: {df[‘Date’].min()} to {df[‘Date’].max()}”) print(f”Total Revenue: ${df[‘Revenue’].sum():,.2f}”) print(f”nColumns: {list(df.columns)}”) print(“nFirst few rows:”) print(df.head()) We execute the dataset generation function and display key insights, including total transactions, revenue range, and sample records. We get a clear snapshot of the data’s structure and confirm that it’s suitable for detailed analysis. Check out the FULL CODES here. Copy CodeCopiedUse a different Browser daily_sales = df.groupby(‘Date’).agg({ ‘Revenue’: ‘sum’, ‘Quantity’: ‘sum’, ‘Customer_Satisfaction’: ‘mean’ }).reset_index() category_analysis = df.groupby(‘Category’).agg({ ‘Revenue’: [‘sum’, ‘mean’], ‘Quantity’: ‘sum’, ‘Customer_Satisfaction’: ‘mean’, ‘Profit_Margin’: ‘sum’ }).reset_index() category_analysis.columns = [‘Category’, ‘Total_Revenue’, ‘Avg_Order_Value’, ‘Total_Quantity’, ‘Avg_Satisfaction’, ‘Total_Profit’] segment_analysis = df.groupby([‘Customer_Segment’, ‘Region’]).agg({ ‘Revenue’: ‘sum’, ‘Customer_Satisfaction’: ‘mean’ }).reset_index() print(“n” + “=”*50) print(“DATASET READY FOR PYGWALKER VISUALIZATION”) print(“=”*50) We perform data aggregations to prepare multiple analytical perspectives, including time-based trends, category-level summaries, and performance metrics for customer segments. We organize this information to make it easily visualizable in PyGWalker. Check out the FULL CODES here. Copy CodeCopiedUse a different Browser print(“n Launching PyGWalker Interactive Interface…”) walker = pyg.walk( df, spec=”./pygwalker_config.json”, use_kernel_calc=True, theme_key=’g2′ ) print(“n PyGWalker is now running!”) print(” Try creating these visualizations:”) print(” – Revenue trend over time (line chart)”) print(” – Category distribution (pie chart)”) print(” – Price vs Satisfaction scatter plot”) print(” – Regional sales heatmap”) print(” – Discount effectiveness analysis”) We launch the PyGWalker interactive interface to visually explore our dataset. We create meaningful charts, uncover trends in sales, satisfaction, and pricing, and observe how interactive visualization enhances our analytical understanding. Data View Visualization Chat with Data In conclusion, we developed a comprehensive data visualization workflow using PyGWalker, encompassing dataset generation, feature engineering, multidimensional analysis, and interactive exploration. We experience how PyGWalker transforms raw tabular data into rich, exploratory dashboards without needing complex code or BI tools. Through this exercise, we strengthen our ability to derive insights quickly, experiment visually, and connect data storytelling directly to practical business understanding. Check out the FULL CODES here. Feel free to check out our GitHub Page for Tutorials, Codes and Notebooks. Also, feel free to follow us on Twitter and don’t forget to join our 100k+ ML SubReddit and Subscribe to our Newsletter. Wait! are you on telegram? now you can join us on telegram as well. The post How to Build an End-to-End Interactive Analytics Dashboard Using PyGWalker Features for Insightful Data Exploration appeared first on MarkTechPost.

How to Build an End-to-End Interactive Analytics Dashboard Using PyGWalker Features for Insightful Data Exploration Leggi l'articolo »

AI, Committee, Notizie, Uncategorized

When AI Agents Collude Online: Financial Fraud Risks by Collaborative LLM Agents on Social Platforms

arXiv:2511.06448v1 Announce Type: cross Abstract: In this work, we study the risks of collective financial fraud in large-scale multi-agent systems powered by large language model (LLM) agents. We investigate whether agents can collaborate in fraudulent behaviors, how such collaboration amplifies risks, and what factors influence fraud success. To support this research, we present MultiAgentFraudBench, a large-scale benchmark for simulating financial fraud scenarios based on realistic online interactions. The benchmark covers 28 typical online fraud scenarios, spanning the full fraud lifecycle across both public and private domains. We further analyze key factors affecting fraud success, including interaction depth, activity level, and fine-grained collaboration failure modes. Finally, we propose a series of mitigation strategies, including adding content-level warnings to fraudulent posts and dialogues, using LLMs as monitors to block potentially malicious agents, and fostering group resilience through information sharing at the societal level. Notably, we observe that malicious agents can adapt to environmental interventions. Our findings highlight the real-world risks of multi-agent financial fraud and suggest practical measures for mitigating them. Code is available at https://github.com/zheng977/MutiAgent4Fraud.

When AI Agents Collude Online: Financial Fraud Risks by Collaborative LLM Agents on Social Platforms Leggi l'articolo »

AI, Committee, Notizie, Uncategorized

A Coding Implementation to Build and Train Advanced Architectures with Residual Connections, Self-Attention, and Adaptive Optimization Using JAX, Flax, and Optax

In this tutorial, we explore how to build and train an advanced neural network using JAX, Flax, and Optax in an efficient and modular way. We begin by designing a deep architecture that integrates residual connections and self-attention mechanisms for expressive feature learning. As we progress, we implement sophisticated optimization strategies with learning rate scheduling, gradient clipping, and adaptive weight decay. Throughout the process, we leverage JAX transformations such as jit, grad, and vmap to accelerate computation and ensure smooth training performance across devices. Check out the FULL CODES here. Copy CodeCopiedUse a different Browser !pip install jax jaxlib flax optax matplotlib import jax import jax.numpy as jnp from jax import random, jit, vmap, grad import flax.linen as nn from flax.training import train_state import optax import matplotlib.pyplot as plt from typing import Any, Callable print(f”JAX version: {jax.__version__}”) print(f”Devices: {jax.devices()}”) We begin by installing and importing JAX, Flax, and Optax, along with essential utilities for numerical operations and visualization. We check our device setup to ensure that JAX is running efficiently on available hardware. This setup forms the foundation for the entire training pipeline. Check out the FULL CODES here. Copy CodeCopiedUse a different Browser class SelfAttention(nn.Module): num_heads: int dim: int @nn.compact def __call__(self, x): B, L, D = x.shape head_dim = D // self.num_heads qkv = nn.Dense(3 * D)(x) qkv = qkv.reshape(B, L, 3, self.num_heads, head_dim) q, k, v = jnp.split(qkv, 3, axis=2) q, k, v = q.squeeze(2), k.squeeze(2), v.squeeze(2) attn_scores = jnp.einsum(‘bhqd,bhkd->bhqk’, q, k) / jnp.sqrt(head_dim) attn_weights = jax.nn.softmax(attn_scores, axis=-1) attn_output = jnp.einsum(‘bhqk,bhvd->bhqd’, attn_weights, v) attn_output = attn_output.reshape(B, L, D) return nn.Dense(D)(attn_output) class ResidualBlock(nn.Module): features: int @nn.compact def __call__(self, x, training: bool = True): residual = x x = nn.Conv(self.features, (3, 3), padding=’SAME’)(x) x = nn.BatchNorm(use_running_average=not training)(x) x = nn.relu(x) x = nn.Conv(self.features, (3, 3), padding=’SAME’)(x) x = nn.BatchNorm(use_running_average=not training)(x) if residual.shape[-1] != self.features: residual = nn.Conv(self.features, (1, 1))(residual) return nn.relu(x + residual) class AdvancedCNN(nn.Module): num_classes: int = 10 @nn.compact def __call__(self, x, training: bool = True): x = nn.Conv(32, (3, 3), padding=’SAME’)(x) x = nn.relu(x) x = ResidualBlock(64)(x, training) x = ResidualBlock(64)(x, training) x = nn.max_pool(x, (2, 2), strides=(2, 2)) x = ResidualBlock(128)(x, training) x = ResidualBlock(128)(x, training) x = jnp.mean(x, axis=(1, 2)) x = x[:, None, :] x = SelfAttention(num_heads=4, dim=128)(x) x = x.squeeze(1) x = nn.Dense(256)(x) x = nn.relu(x) x = nn.Dropout(0.5, deterministic=not training)(x) x = nn.Dense(self.num_classes)(x) return x We define a deep neural network that combines residual blocks and a self-attention mechanism for enhanced feature learning. We construct the layers modularly, ensuring that the model can capture both spatial and contextual relationships. This design enables the network to generalize effectively across various types of input data. Check out the FULL CODES here. Copy CodeCopiedUse a different Browser class TrainState(train_state.TrainState): batch_stats: Any def create_learning_rate_schedule(base_lr: float = 1e-3, warmup_steps: int = 100, decay_steps: int = 1000) -> optax.Schedule: warmup_fn = optax.linear_schedule(init_value=0.0, end_value=base_lr, transition_steps=warmup_steps) decay_fn = optax.cosine_decay_schedule(init_value=base_lr, decay_steps=decay_steps, alpha=0.1) return optax.join_schedules(schedules=[warmup_fn, decay_fn], boundaries=[warmup_steps]) def create_optimizer(learning_rate_schedule: optax.Schedule) -> optax.GradientTransformation: return optax.chain(optax.clip_by_global_norm(1.0), optax.adamw(learning_rate=learning_rate_schedule, weight_decay=1e-4)) We create a custom training state that tracks model parameters and batch statistics. We also define a learning rate schedule with warmup and cosine decay, paired with an AdamW optimizer that includes gradient clipping and weight decay. This combination ensures stable and adaptive training. Check out the FULL CODES here. Copy CodeCopiedUse a different Browser @jit def compute_metrics(logits, labels): loss = optax.softmax_cross_entropy_with_integer_labels(logits, labels).mean() accuracy = jnp.mean(jnp.argmax(logits, -1) == labels) return {‘loss’: loss, ‘accuracy’: accuracy} def create_train_state(rng, model, input_shape, learning_rate_schedule): variables = model.init(rng, jnp.ones(input_shape), training=False) params = variables[‘params’] batch_stats = variables.get(‘batch_stats’, {}) tx = create_optimizer(learning_rate_schedule) return TrainState.create(apply_fn=model.apply, params=params, tx=tx, batch_stats=batch_stats) @jit def train_step(state, batch, dropout_rng): images, labels = batch def loss_fn(params): variables = {‘params’: params, ‘batch_stats’: state.batch_stats} logits, new_model_state = state.apply_fn(variables, images, training=True, mutable=[‘batch_stats’], rngs={‘dropout’: dropout_rng}) loss = optax.softmax_cross_entropy_with_integer_labels(logits, labels).mean() return loss, (logits, new_model_state) grad_fn = jax.value_and_grad(loss_fn, has_aux=True) (loss, (logits, new_model_state)), grads = grad_fn(state.params) state = state.apply_gradients(grads=grads, batch_stats=new_model_state[‘batch_stats’]) metrics = compute_metrics(logits, labels) return state, metrics @jit def eval_step(state, batch): images, labels = batch variables = {‘params’: state.params, ‘batch_stats’: state.batch_stats} logits = state.apply_fn(variables, images, training=False) return compute_metrics(logits, labels) We implement JIT-compiled training and evaluation functions to achieve efficient execution. The training step computes gradients, updates parameters, and dynamically maintains batch statistics. We also define evaluation metrics that help us monitor loss and accuracy throughout the training process. Check out the FULL CODES here. Copy CodeCopiedUse a different Browser def generate_synthetic_data(rng, num_samples=1000, img_size=32): rng_x, rng_y = random.split(rng) images = random.normal(rng_x, (num_samples, img_size, img_size, 3)) labels = random.randint(rng_y, (num_samples,), 0, 10) return images, labels def create_batches(images, labels, batch_size=32): num_batches = len(images) // batch_size for i in range(num_batches): idx = slice(i * batch_size, (i + 1) * batch_size) yield images[idx], labels[idx] We generate synthetic data to simulate an image classification task, enabling us to train the model without relying on external datasets. We then batch the data efficiently for iterative updates. This approach allows us to test the full pipeline quickly and verify that all components function correctly. Check out the FULL CODES here. Copy CodeCopiedUse a different Browser def train_model(num_epochs=5, batch_size=32): rng = random.PRNGKey(0) rng, data_rng, model_rng = random.split(rng, 3) train_images, train_labels = generate_synthetic_data(data_rng, num_samples=1000) test_images, test_labels = generate_synthetic_data(data_rng, num_samples=200) model = AdvancedCNN(num_classes=10) lr_schedule = create_learning_rate_schedule(base_lr=1e-3, warmup_steps=50, decay_steps=500) state = create_train_state(model_rng, model, (1, 32, 32, 3), lr_schedule) history = {‘train_loss’: [], ‘train_acc’: [], ‘test_acc’: []} print(“Starting training…”) for epoch in range(num_epochs): train_metrics = [] for batch in create_batches(train_images, train_labels, batch_size): rng, dropout_rng = random.split(rng) state, metrics = train_step(state, batch, dropout_rng) train_metrics.append(metrics) train_loss = jnp.mean(jnp.array([m[‘loss’] for m in train_metrics])) train_acc = jnp.mean(jnp.array([m[‘accuracy’] for m in train_metrics])) test_metrics = [eval_step(state, batch) for batch in create_batches(test_images, test_labels, batch_size)] test_acc = jnp.mean(jnp.array([m[‘accuracy’] for m in test_metrics])) history[‘train_loss’].append(float(train_loss)) history[‘train_acc’].append(float(train_acc)) history[‘test_acc’].append(float(test_acc)) print(f”Epoch {epoch + 1}/{num_epochs}: Loss: {train_loss:.4f}, Train Acc: {train_acc:.4f}, Test Acc: {test_acc:.4f}”) return history, state history, trained_state = train_model(num_epochs=5) fig, (ax1, ax2) = plt.subplots(1, 2, figsize=(12, 4)) ax1.plot(history[‘train_loss’], label=’Train Loss’) ax1.set_xlabel(‘Epoch’); ax1.set_ylabel(‘Loss’); ax1.set_title(‘Training Loss’); ax1.legend(); ax1.grid(True) ax2.plot(history[‘train_acc’], label=’Train Accuracy’) ax2.plot(history[‘test_acc’], label=’Test Accuracy’) ax2.set_xlabel(‘Epoch’); ax2.set_ylabel(‘Accuracy’); ax2.set_title(‘Model Accuracy’); ax2.legend(); ax2.grid(True) plt.tight_layout(); plt.show() print(“n Tutorial complete! This covers:”) print(“- Custom Flax modules (ResNet blocks, Self-Attention)”) print(“- Advanced Optax optimizers (AdamW with gradient clipping)”)

A Coding Implementation to Build and Train Advanced Architectures with Residual Connections, Self-Attention, and Adaptive Optimization Using JAX, Flax, and Optax Leggi l'articolo »

AI, Committee, Notizie, Uncategorized

Rep2Text: Decoding Full Text from a Single LLM Token Representation

arXiv:2511.06571v1 Announce Type: new Abstract: Large language models (LLMs) have achieved remarkable progress across diverse tasks, yet their internal mechanisms remain largely opaque. In this work, we address a fundamental question: to what extent can the original input text be recovered from a single last-token representation within an LLM? We propose Rep2Text, a novel framework for decoding full text from last-token representations. Rep2Text employs a trainable adapter that projects a target model’s internal representations into the embedding space of a decoding language model, which then autoregressively reconstructs the input text. Experiments on various model combinations (Llama-3.1-8B, Gemma-7B, Mistral-7B-v0.1, Llama-3.2-3B) demonstrate that, on average, over half of the information in 16-token sequences can be recovered from this compressed representation while maintaining strong semantic integrity and coherence. Furthermore, our analysis reveals an information bottleneck effect: longer sequences exhibit decreased token-level recovery while preserving strong semantic integrity. Besides, our framework also demonstrates robust generalization to out-of-distribution medical data.

Rep2Text: Decoding Full Text from a Single LLM Token Representation Leggi l'articolo »

We use cookies to improve your experience and performance on our website. You can learn more at Politica sulla privacy and manage your privacy settings by clicking Settings.

Privacy Preferences

You can choose your cookie settings by turning on/off each type of cookie as you wish, except for essential cookies.

Allow All
Manage Consent Preferences
  • Always Active

Save
it_IT